<< Chapter < Page Chapter >> Page >
  • Graph exponential functions.
  • Graph exponential functions using transformations.

As we discussed in the previous section, exponential functions are used for many real-world applications such as finance, forensics, computer science, and most of the life sciences. Working with an equation that describes a real-world situation gives us a method for making predictions. Most of the time, however, the equation itself is not enough. We learn a lot about things by seeing their pictorial representations, and that is exactly why graphing exponential equations is a powerful tool. It gives us another layer of insight for predicting future events.

Graphing exponential functions

Before we begin graphing, it is helpful to review the behavior of exponential growth. Recall the table of values for a function of the form f ( x ) = b x whose base is greater than one. We’ll use the function f ( x ) = 2 x . Observe how the output values in [link] change as the input increases by 1.

x 3 2 1 0 1 2 3
f ( x ) = 2 x 1 8 1 4 1 2 1 2 4 8

Each output value is the product of the previous output and the base, 2. We call the base 2 the constant ratio . In fact, for any exponential function with the form f ( x ) = a b x , b is the constant ratio of the function. This means that as the input increases by 1, the output value will be the product of the base and the previous output, regardless of the value of a .

Notice from the table that

  • the output values are positive for all values of x ;
  • as x increases, the output values increase without bound; and
  • as x decreases, the output values grow smaller, approaching zero.

[link] shows the exponential growth function f ( x ) = 2 x .
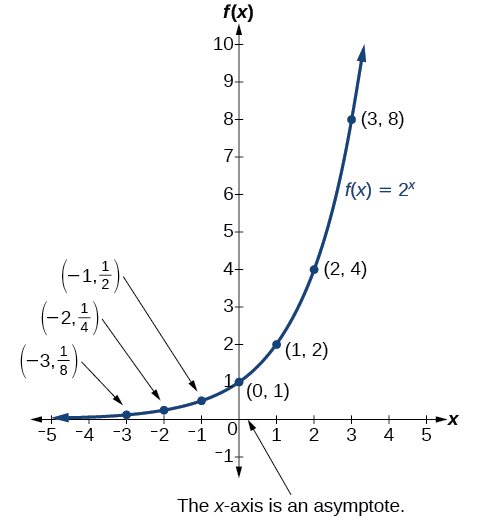
Graph of the exponential function, 2^(x), with labeled points at (-3, 1/8), (-2, ¼), (-1, ½), (0, 1), (1, 2), (2, 4), and (3, 8). The graph notes that the x-axis is an asymptote.
Notice that the graph gets close to the x -axis, but never touches it.

The domain of f ( x ) = 2 x is all real numbers, the range is ( 0 , ) , and the horizontal asymptote is y = 0.

To get a sense of the behavior of exponential decay , we can create a table of values for a function of the form f ( x ) = b x whose base is between zero and one. We’ll use the function g ( x ) = ( 1 2 ) x . Observe how the output values in [link] change as the input increases by 1.

x -3 -2 -1 0 1 2 3
g ( x ) = ( 1 2 ) x 8 4 2 1 1 2 1 4 1 8

Again, because the input is increasing by 1, each output value is the product of the previous output and the base, or constant ratio 1 2 .

Notice from the table that

  • the output values are positive for all values of x ;
  • as x increases, the output values grow smaller, approaching zero; and
  • as x decreases, the output values grow without bound.

[link] shows the exponential decay function, g ( x ) = ( 1 2 ) x .
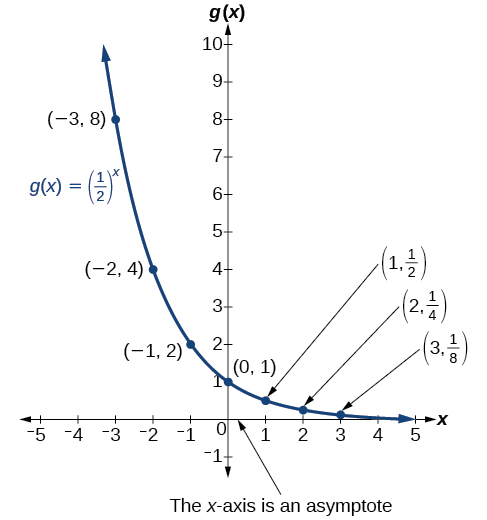
Graph of decreasing exponential function, (1/2)^x, with labeled points at (-3, 8), (-2, 4), (-1, 2), (0, 1), (1, 1/2), (2, 1/4), and (3, 1/8). The graph notes that the x-axis is an asymptote.

The domain of g ( x ) = ( 1 2 ) x is all real numbers, the range is ( 0 , ) , and the horizontal asymptote is y = 0.

Characteristics of the graph of the parent function f ( x ) = b x

An exponential function with the form f ( x ) = b x , b > 0 , b 1 , has these characteristics:

  • one-to-one function
  • horizontal asymptote: y = 0
  • domain: ( ,   )
  • range: ( 0 , )
  • x- intercept: none
  • y- intercept: ( 0 , 1 )
  • increasing if b > 1
  • decreasing if b < 1

[link] compares the graphs of exponential growth    and decay functions.
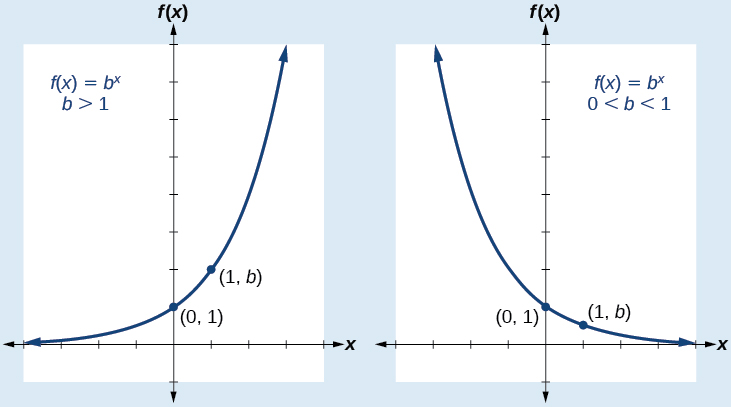
Graph of two functions where the first graph is of a function of f(x) = b^x when b>1 and the second graph is of the same function when b is 0<b<1. Both graphs have the points (0, 1) and (1, b) labeled.

Given an exponential function of the form f ( x ) = b x , graph the function.

  1. Create a table of points.
  2. Plot at least 3 point from the table, including the y -intercept ( 0 , 1 ) .
  3. Draw a smooth curve through the points.
  4. State the domain, ( , ) , the range, ( 0 , ) , and the horizontal asymptote, y = 0.

Questions & Answers

what is biology
Hajah Reply
the study of living organisms and their interactions with one another and their environments
AI-Robot
what is biology
Victoria Reply
HOW CAN MAN ORGAN FUNCTION
Alfred Reply
the diagram of the digestive system
Assiatu Reply
allimentary cannel
Ogenrwot
How does twins formed
William Reply
They formed in two ways first when one sperm and one egg are splited by mitosis or two sperm and two eggs join together
Oluwatobi
what is genetics
Josephine Reply
Genetics is the study of heredity
Misack
how does twins formed?
Misack
What is manual
Hassan Reply
discuss biological phenomenon and provide pieces of evidence to show that it was responsible for the formation of eukaryotic organelles
Joseph Reply
what is biology
Yousuf Reply
the study of living organisms and their interactions with one another and their environment.
Wine
discuss the biological phenomenon and provide pieces of evidence to show that it was responsible for the formation of eukaryotic organelles in an essay form
Joseph Reply
what is the blood cells
Shaker Reply
list any five characteristics of the blood cells
Shaker
lack electricity and its more savely than electronic microscope because its naturally by using of light
Abdullahi Reply
advantage of electronic microscope is easily and clearly while disadvantage is dangerous because its electronic. advantage of light microscope is savely and naturally by sun while disadvantage is not easily,means its not sharp and not clear
Abdullahi
cell theory state that every organisms composed of one or more cell,cell is the basic unit of life
Abdullahi
is like gone fail us
DENG
cells is the basic structure and functions of all living things
Ramadan
What is classification
ISCONT Reply
is organisms that are similar into groups called tara
Yamosa
in what situation (s) would be the use of a scanning electron microscope be ideal and why?
Kenna Reply
A scanning electron microscope (SEM) is ideal for situations requiring high-resolution imaging of surfaces. It is commonly used in materials science, biology, and geology to examine the topography and composition of samples at a nanoscale level. SEM is particularly useful for studying fine details,
Hilary
cell is the building block of life.
Condoleezza Reply
Got questions? Join the online conversation and get instant answers!
Jobilize.com Reply

Get Jobilize Job Search Mobile App in your pocket Now!

Get it on Google Play Download on the App Store Now


Source:  OpenStax, Precalculus. OpenStax CNX. Jan 19, 2016 Download for free at https://legacy.cnx.org/content/col11667/1.6
Google Play and the Google Play logo are trademarks of Google Inc.

Notification Switch

Would you like to follow the 'Precalculus' conversation and receive update notifications?

Ask