

| << Chapter < Page | Chapter >> Page > |
Differential scanning calorimetry (DSC) is a technique used to measure the difference in the heat flow rate of a sample and a reference over a controlled temperature range. These measurements are used to create phase diagrams and gather thermoanalytical information such as transition temperatures and enthalpies.
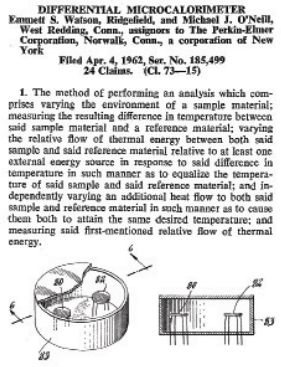
DSC was developed in 1962 by Perkin-Elmer employees Emmett Watson and Michael O’Neill and was introduced at the Pittsburgh Conference on Analytical Chemistry and Applied Spectroscopy ( [link] ). The equipment for this technique was available to purchase beginning in 1963 and has evolved to control temperatures more accurately and take measurements more precisely, ensuring repeatability and high sensitivity.
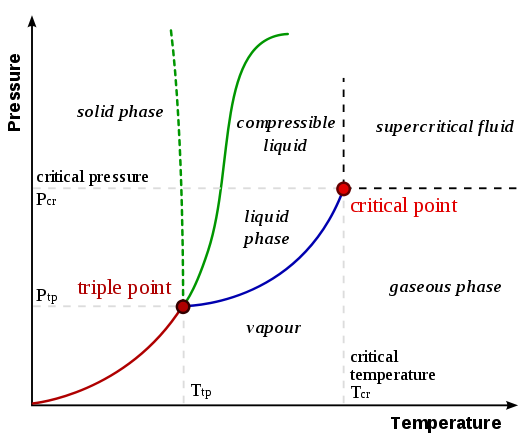
Phase transitions refer to the transformation from one state of matter to another. Solids, liquids, and gasses are changed to other states as the thermodynamic system is altered, thereby affecting the sample and its properties. Measuring these transitions and determining the properties of the sample is important in many industrial settings and can be used to ensure purity and determine composition (such as with polymer ratios). Phase diagrams ( [link] ) can be used to clearly demonstrate the transitions in graphical form, helping visualize the transition points and different states as the thermodynamic system is changed.
Prior to DSC, differential thermal analysis (DTA) was used to gather information about transition states of materials. In DTA, the sample and reference are heated simultaneously with the same amount of heat and the temperature of each is monitored independently. The difference between the sample temperature and the reference temperature gives information about the exothermic or endothermic transition occurring in the sample. This strategy was used as the foundation for DSC, which sought to measure the difference in energy needed to keep the temperatures the same instead of measure the difference in temperature from the same amount of energy.
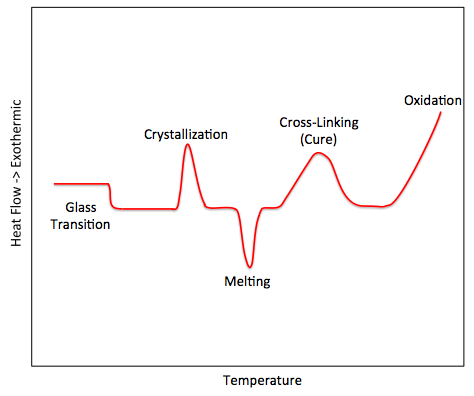
Instead of measuring temperature changes as heat is applied as in DTA, DSC measures the amount of heat that is needed to increase the temperatures of the sample and reference across a temperature gradient. The sample and reference are kept at the same temperature as it changes across the gradient, and the differing amounts of heat required to keep the temperatures synchronized are measured. As the sample undergoes phase transitions, more or less heat is needed, which allows for phase diagrams to be created from the data. Additionally, specific heat, glass transition temperature, crystallization temperature, melting temperature, and oxidative/thermal stability, among other properties, can be measured using DSC.
DSC is often used in industrial manufacturing, ensuring sample purity and confirming compositional analysis. Also used in materials research, providing information about properties and composition of unknown materials can be determined. DSC has also been used in the food and pharmaceutical industries, providing characterization and enabling the fine-tuning of certain properties. The stability of proteins and folding/unfolding information can also be measured with DSC experiments.
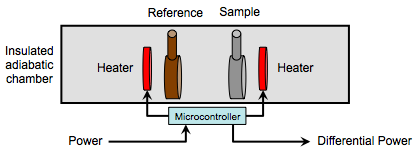
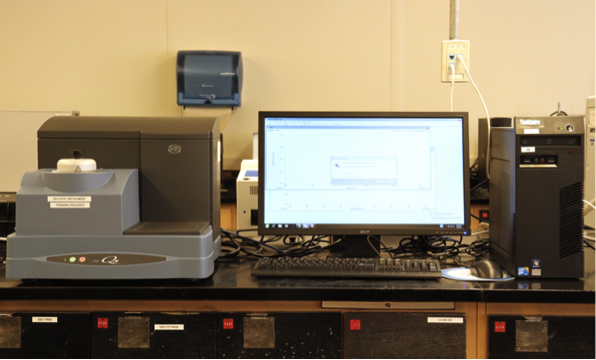
The sample and reference cells (also known as pans), each enclosing their respective materials, are contained in an insulted adiabatic chamber ( [link] ). The cells can be made of a variety of materials, such as aluminum, copper, gold and platinum. The choice of which is dictated by the necessary upper temperature limit. A variable heating element around each cell transfers heat to the sample, causing both cells’ temperature to rise in coordination with the other cell. A temperature monitor measures the temperatures of each cell and a microcontroller controls the variable heating elements and reports the differential power required for heating the sample versus the reference. A typical setup, including a computer for controlling software, is shown in [link] .
With advancement in DSC equipment, several different modes of operations now exist that enhance the applications of DSC. Scanning mode typically refers to conventional DSC, which uses a linear increase or decrease in temperature. An example of an additional mode often found in newer DSC equipment is an isothermal scan mode, which keeps temperature constant while the differential power is measured. This allows for stability studies at constant temperatures, particularly useful in shelf life studies for pharmaceutical drugs.
As with practically all laboratory equipment, calibration is required. Calibration substances, typically pure metals such as indium or lead, are chosen that have clearly defined transition states to ensure that the measured transitions correlate to the literature values.
Sample preparation mostly consists of determining the optimal weight to analyze. There needs to be enough of the sample to accurately represent the material, but the change in heat flow should typically be between 0.1 - 10 mW. The sample should be kept as thin as possible and cover as much of the base of the cell as possible. It is typically better to cut a slice of the sample rather than crush it into a thin layer. The correct reference material also needs to be determined in order to obtain useful data.
DSC curves (e.g., [link] ) typically consist of the heat flow plotted versus the temperature. These curves can be used to calculate the enthalpies of transitions, (ΔH), [link] , by integrating the peak of the state transition, where K is the calorimetric constant and A is the area under the curve.
Common error sources apply, including user and balance errors and improper calibration. Incorrect choice of reference material and improper quantity of sample are frequent errors. Additionally, contamination and how the sample is loaded into the cell affect the DSC.
Notification Switch
Would you like to follow the 'Physical methods in chemistry and nano science' conversation and receive update notifications?

|
|

|
|

|
|

|
|

|
|

|
|

|
|

|
|

|
|

|