<< Chapter < Page Chapter >> Page >

Data collection for hydrogen pulse chemisorption

The sample from previous experiment (TPR) will be used for this experiment. Ultra high-purity argon will be used to purge the sample at a flow rate of 40 cm 3 /min. The sample will be heated to 200 °C in order to remove all chemisorbed hydrogen atoms from the Pd(0) surface. The sample is cooled down to 40 °C. Argon will be used as carrier gas at a flow of 40 cm 3 /min. Filaments temperature will be 175 °C and the detector temperature will be 110 °C. The injection loop has a volume of 0.03610 cm 3 @ STP. As shown in [link] ., hydrogen pulses will be injected in to the flow stream, carried by argon to become in contact and react with the sample. It should be noted that the first pulse of hydrogen was almost completely adsorbed by the sample. The second and third pulses show how the samples is been saturated. The positive value of the TCD detector is consistent with our assumptions. Since hydrogen has a higher thermal conductivity than argon, as it flows through the detector it will tend to cool down the filaments, the detector will then apply a positive voltage to the filaments in order to maintain a constant temperature.

chemi
A typical hydrogen pulse chemisorption profile of 1 wt% Pd/Al 2 O 3 .

Pulse chemisorption data analysis

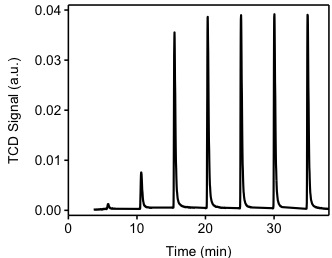
[link] shows the integration of the peaks from [link] . This integration is performed by an automated software provided with the instrument. It should be noted that the first pulse was completely consumed by the sample, the pulse was injected between time 0 and 5 minutes. From [link] we observe that during the first four pulses, hydrogen is consumed by the sample. After the fourth pulse, it appears the sample is not consuming hydrogen. The experiment continues for a total of seven pulses, at this point the software determines that no consumption is occurring and stops the experiment. Pulse eight is denominated the "saturation peak", meaning the pulse at which no hydrogen was consumed.

Hydrogen pulse chemisorption data.
Pulse n Area
1 0
2 0.000471772
3 0.00247767
4 0.009846683
5 0.010348201
6 0.010030243
7 0.009967717
8 0.010580979

Using [link] the change in area (Δarea n ) is calculated for each peak pulse area (area n )and compared to that of the saturation pulse area (area saturation = 0.010580979). Each of these changes in area is proportional to an amount of hydrogen consumed by the sample in each pulse. [link] Shows the calculated change in area.

Δ Area n =Area saturation -Area n MathType@MTEF@5@5@+=faaagCart1ev2aaaKnaaaaWenf2ys9wBH5garuavP1wzZbqedmvETj2BSbqefm0B1jxALjharqqtubsr4rNCHbGeaGqiVu0Je9sqqrpepC0xbbL8FesqqrFfpeea0xe9Lq=Jc9vqaqpepm0xbba9pwe9Q8fs0=yqaqpepae9pg0FirpepeKkFr0xfr=xfr=xb9Gqpi0dc9adbaqaaeGaciGaaiaabeqaamaabaabaaGcbaGaeuiLdqKaaeyqaiaabkhacaqGLbGaaeyyamaaBaaaleaacaqGWbGaaeyzaiaabggacaqGRbGaaeOtaaqabaGccaqG9aGaaeyqaiaabkhacaqGLbGaaeyyamaaBaaaleaacaqGZbGaaeyyaiaabshacaqG1bGaaeOCaiaabggacaqG0bGaaeyAaiaab+gacaqGUbaabeaakiaab2cacaqGbbGaaeOCaiaabwgacaqGHbWaaSbaaSqaaiaabchacaqGLbGaaeyyaiaabUgacaqGobaabeaaaaa@4E7A@
Hydrogen pulse chemisorption data with ΔArea.
Pulse n Area n ΔArea n
1 0 0.010580979
2 0.000471772 0.0105338018
3 0.00247767 0.008103309
4 0.009846683 0.000734296
5 0.010348201 0.000232778
6 0.010030243 0.000550736
7 0.009967717 0.000613262
8 0.010580979 0

The Δarea n values are then converted into hydrogen gas consumption using [link] , where F c is the area-to-volume conversion factor for hydrogen and SW is the weight of the sample. F c is equal to 2.6465 cm 3 /peak area. [link] shows the results of the volume adsorbed and the cumulative volume adsorbed. Using the data on [link] , a series of calculations can now be performed in order to have a better understanding of our catalyst properties.

Questions & Answers

how does Neisseria cause meningitis
Nyibol Reply
what is microbiologist
Muhammad Reply
what is errata
Muhammad
is the branch of biology that deals with the study of microorganisms.
Ntefuni Reply
What is microbiology
Mercy Reply
studies of microbes
Louisiaste
when we takee the specimen which lumbar,spin,
Ziyad Reply
How bacteria create energy to survive?
Muhamad Reply
Bacteria doesn't produce energy they are dependent upon their substrate in case of lack of nutrients they are able to make spores which helps them to sustain in harsh environments
_Adnan
But not all bacteria make spores, l mean Eukaryotic cells have Mitochondria which acts as powerhouse for them, since bacteria don't have it, what is the substitution for it?
Muhamad
they make spores
Louisiaste
what is sporadic nd endemic, epidemic
Aminu Reply
the significance of food webs for disease transmission
Abreham
food webs brings about an infection as an individual depends on number of diseased foods or carriers dully.
Mark
explain assimilatory nitrate reduction
Esinniobiwa Reply
Assimilatory nitrate reduction is a process that occurs in some microorganisms, such as bacteria and archaea, in which nitrate (NO3-) is reduced to nitrite (NO2-), and then further reduced to ammonia (NH3).
Elkana
This process is called assimilatory nitrate reduction because the nitrogen that is produced is incorporated in the cells of microorganisms where it can be used in the synthesis of amino acids and other nitrogen products
Elkana
Examples of thermophilic organisms
Shu Reply
Give Examples of thermophilic organisms
Shu
advantages of normal Flora to the host
Micheal Reply
Prevent foreign microbes to the host
Abubakar
they provide healthier benefits to their hosts
ayesha
They are friends to host only when Host immune system is strong and become enemies when the host immune system is weakened . very bad relationship!
Mark
what is cell
faisal Reply
cell is the smallest unit of life
Fauziya
cell is the smallest unit of life
Akanni
ok
Innocent
cell is the structural and functional unit of life
Hasan
is the fundamental units of Life
Musa
what are emergency diseases
Micheal Reply
There are nothing like emergency disease but there are some common medical emergency which can occur simultaneously like Bleeding,heart attack,Breathing difficulties,severe pain heart stock.Hope you will get my point .Have a nice day ❣️
_Adnan
define infection ,prevention and control
Innocent
I think infection prevention and control is the avoidance of all things we do that gives out break of infections and promotion of health practices that promote life
Lubega
Heyy Lubega hussein where are u from?
_Adnan
en français
Adama
which site have a normal flora
ESTHER Reply
Many sites of the body have it Skin Nasal cavity Oral cavity Gastro intestinal tract
Safaa
skin
Asiina
skin,Oral,Nasal,GIt
Sadik
How can Commensal can Bacteria change into pathogen?
Sadik
How can Commensal Bacteria change into pathogen?
Sadik
all
Tesfaye
by fussion
Asiina
what are the advantages of normal Flora to the host
Micheal
what are the ways of control and prevention of nosocomial infection in the hospital
Micheal
what is inflammation
Shelly Reply
part of a tissue or an organ being wounded or bruised.
Wilfred
what term is used to name and classify microorganisms?
Micheal Reply
Binomial nomenclature
adeolu
Got questions? Join the online conversation and get instant answers!
Jobilize.com Reply

Get Jobilize Job Search Mobile App in your pocket Now!

Get it on Google Play Download on the App Store Now


Source:  OpenStax, Physical methods in chemistry and nano science. OpenStax CNX. May 05, 2015 Download for free at http://legacy.cnx.org/content/col10699/1.21
Google Play and the Google Play logo are trademarks of Google Inc.

Notification Switch

Would you like to follow the 'Physical methods in chemistry and nano science' conversation and receive update notifications?

Ask