<< Chapter < Page Chapter >> Page >
General schematic of DMA analyzer.

The DMA should be ideally selected to analyze the material at hand. The DMA can be either stress or strain controlled: strain-controlled analyzers move the probe a certain distance and measure the stress applied; strain-controlled analyzers provide a constant deformation of the sample ( Figure 4 ). Although the two techniques are nearly equivalent when the stress-strain plot ( Figure 1 ) is linear, stress-controlled analyzers provide more accurate results.

Types of DMA. (a) Axially applied stress. (b) Torsionally applied stress. (c) Stress-controlled analyzer uses set movements. (d) Deformation is regulated in strain-controlled analyzers. Figure adapted from M. Sepe, Dynamic Mechanical Analysis for Plastics Engineering , Plastics Design Library: Norwich, NY (1998).

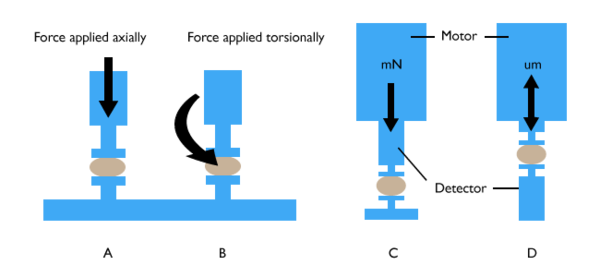
DMA analyzers can also apply stress or strain in two manners—axial and torsional deformation ( Figure 4 ). Axial deformation applies a linear force to the sample and is typically used for solid and semisolid materials to test flex, tensile strength, and compression. Torsional analyzers apply force in a twisting motion; this type of analysis is used for liquids and polymer melts but can also be applied to solids. Although both types of analyzers have wide analysis range and can be used for similar samples, the axial instrument should not be used for fluid samples with viscosities below 500 Pa-s, and torsional analyzers cannot handle materials with high modulus.

Different fixtures can be used to hold the samples in place and should be chosen according to the type of samples analyzed. The sample geometry affects both stress and strain and must be factored into the modulus calculations through a geometry factor. The fixture systems are specific to the type of stress application. Axial analyzers have a greater number of fixture options; one of the most commonly used fixtures is extension/tensile geometry used for thin films or fibers. In this method, the sample is held both vertically and lengthwise by top and bottom clamps, and stress is applied upwards ( Figure 5 ).

Axial analyzer with DMA instrument (left) and axial analyzer with extension/tensile geometry (right).

For torsional analyzers, the simplest geometry is the use of parallel plates. The plates are separated by a distance determined by the viscosity of the sample. Because the movement of the sample depends on its radius from the center of the plate, the stress applied is uneven; the measured strain is an average value.

Dma of the glass transition of polymers

As the temperature of a polymer increases, the material goes through a number of minor transitions ( T γ and T β ) due to expansion; at these transitions, the modulus also undergoes changes. The glass transition of polymers ( T g ) occurs with the abrupt change of physical properties within 140-160 o C; at some temperature within this range, the storage (elastic) modulus of the polymer drops dramatically. As the temperature rises above the glass transition point, the material loses its structure and becomes rubbery before finally melting. The idealized modulus transition is pictured in Figure 6 .

Ideal storage modulus transitions of viscoelastic polymers. Adapted from K. P. Menard, Dynamic Mechanical Analysis: A Practical Introduction , 2nd ed., CRC Press: Boca Raton, FL (2008).

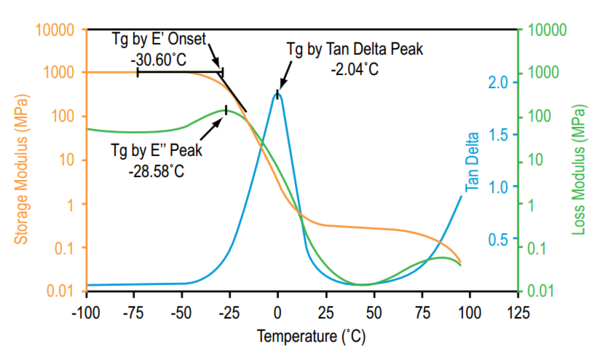
The glass transition temperature can be determined using either the storage modulus, complex modulus, or tan δ (vs temperature) depending on context and instrument; because these methods result in such a range of values ( Figure 7 ), the method of calculation should be noted. When using the storage modulus, the temperature at which E’ begins to decline is used as the T g . Tan δ and loss modulus E” show peaks at the glass transition; either onset or peak values can be used in determining T g . These different methods of measurement are depicted graphically in Figure 7 .

Different industrial methods of calculating glass transition temperature ( T g ). Copyright 2014, TA Instruments. Used with permission.

Advantages and limitations of dma

Dynamic mechanical analysis is an essential analytical technique for determining the viscoelastic properties of polymers. Unlike many comparable methods, DMA can provide information on major and minor transitions of materials; it is also more sensitive to changes after the glass transition temperature of polymers. Due to its use of oscillating stress, this method is able to quickly scan and calculate the modulus for a range of temperatures. As a result, it is the only technique that can determine the basic structure of a polymer system while providing data on the modulus as a function of temperature. Finally, the environment of DMA tests can be controlled to mimic real-world operating conditions, so this analytical method is able to accurately predict the performance of materials in use.

DMA does possess limitations that lead to calculation inaccuracies. The modulus value is very dependent on sample dimensions, which means large inaccuracies are introduced if dimensional measurements of samples are slightly inaccurate. Additionally, overcoming the inertia of the instrument used to apply oscillating stress converts mechanical energy to heat and changes the temperature of the sample. Since maintaining exact temperatures is important in temperature scans, this also introduces inaccuracies. Because data processing of DMA is largely automated, the final source of measurement uncertainty comes from computer error.

Bibliography

  • K. P Menard, Dynamic Mechanical Analysis: A Practical Introduction , 2nd ed., CRC Press: Boca Raton, FL (2008).
  • M. A. Meyer and K. K. Chawla, Mechanical Properties of materials , 2nd. ed., Cambridge University Press: New York (2009).
  • G. Rotter and H. Ishida, Macromolecules , 1992, 25 , 2170.
  • E. I. Rivin, Stiffness and Damping in Mechanical Design , Marcel Dekker: New York (1999).
  • M. Sepe, Dynamic Mechanical Analysis for Plastics Engineering , Plastics Design Library: Norwich, NY (1998).
  • R. J. Young, Introduction to Polymers, 3rd ed., CRC Press: Boca Raton, FL (2011).

Questions & Answers

differentiate between demand and supply giving examples
Lambiv Reply
differentiated between demand and supply using examples
Lambiv
what is labour ?
Lambiv
how will I do?
Venny Reply
how is the graph works?I don't fully understand
Rezat Reply
information
Eliyee
devaluation
Eliyee
t
WARKISA
hi guys good evening to all
Lambiv
multiple choice question
Aster Reply
appreciation
Eliyee
explain perfect market
Lindiwe Reply
In economics, a perfect market refers to a theoretical construct where all participants have perfect information, goods are homogenous, there are no barriers to entry or exit, and prices are determined solely by supply and demand. It's an idealized model used for analysis,
Ezea
What is ceteris paribus?
Shukri Reply
other things being equal
AI-Robot
When MP₁ becomes negative, TP start to decline. Extuples Suppose that the short-run production function of certain cut-flower firm is given by: Q=4KL-0.6K2 - 0.112 • Where is quantity of cut flower produced, I is labour input and K is fixed capital input (K-5). Determine the average product of lab
Kelo
Extuples Suppose that the short-run production function of certain cut-flower firm is given by: Q=4KL-0.6K2 - 0.112 • Where is quantity of cut flower produced, I is labour input and K is fixed capital input (K-5). Determine the average product of labour (APL) and marginal product of labour (MPL)
Kelo
yes,thank you
Shukri
Can I ask you other question?
Shukri
what is monopoly mean?
Habtamu Reply
What is different between quantity demand and demand?
Shukri Reply
Quantity demanded refers to the specific amount of a good or service that consumers are willing and able to purchase at a give price and within a specific time period. Demand, on the other hand, is a broader concept that encompasses the entire relationship between price and quantity demanded
Ezea
ok
Shukri
how do you save a country economic situation when it's falling apart
Lilia Reply
what is the difference between economic growth and development
Fiker Reply
Economic growth as an increase in the production and consumption of goods and services within an economy.but Economic development as a broader concept that encompasses not only economic growth but also social & human well being.
Shukri
production function means
Jabir
What do you think is more important to focus on when considering inequality ?
Abdisa Reply
any question about economics?
Awais Reply
sir...I just want to ask one question... Define the term contract curve? if you are free please help me to find this answer 🙏
Asui
it is a curve that we get after connecting the pareto optimal combinations of two consumers after their mutually beneficial trade offs
Awais
thank you so much 👍 sir
Asui
In economics, the contract curve refers to the set of points in an Edgeworth box diagram where both parties involved in a trade cannot be made better off without making one of them worse off. It represents the Pareto efficient allocations of goods between two individuals or entities, where neither p
Cornelius
In economics, the contract curve refers to the set of points in an Edgeworth box diagram where both parties involved in a trade cannot be made better off without making one of them worse off. It represents the Pareto efficient allocations of goods between two individuals or entities,
Cornelius
Suppose a consumer consuming two commodities X and Y has The following utility function u=X0.4 Y0.6. If the price of the X and Y are 2 and 3 respectively and income Constraint is birr 50. A,Calculate quantities of x and y which maximize utility. B,Calculate value of Lagrange multiplier. C,Calculate quantities of X and Y consumed with a given price. D,alculate optimum level of output .
Feyisa Reply
Answer
Feyisa
c
Jabir
the market for lemon has 10 potential consumers, each having an individual demand curve p=101-10Qi, where p is price in dollar's per cup and Qi is the number of cups demanded per week by the i th consumer.Find the market demand curve using algebra. Draw an individual demand curve and the market dema
Gsbwnw Reply
suppose the production function is given by ( L, K)=L¼K¾.assuming capital is fixed find APL and MPL. consider the following short run production function:Q=6L²-0.4L³ a) find the value of L that maximizes output b)find the value of L that maximizes marginal product
Abdureman
types of unemployment
Yomi Reply
What is the difference between perfect competition and monopolistic competition?
Mohammed
Got questions? Join the online conversation and get instant answers!
Jobilize.com Reply

Get Jobilize Job Search Mobile App in your pocket Now!

Get it on Google Play Download on the App Store Now


Source:  OpenStax, Physical methods in chemistry and nano science. OpenStax CNX. May 05, 2015 Download for free at http://legacy.cnx.org/content/col10699/1.21
Google Play and the Google Play logo are trademarks of Google Inc.

Notification Switch

Would you like to follow the 'Physical methods in chemistry and nano science' conversation and receive update notifications?

Ask