<< Chapter < Page Chapter >> Page >

This tells us if different heating rates β are used and the left-hand side of the above equation is plotted as a function of 1/T M , we can see that a straight line should be obtained whose slope is ΔE a /R and intercept is ln(ΔE a /RA). So we are able to obtain the activation energy to desorption ΔE a and Arrhenius pre-exponential factor A.

Second-order process

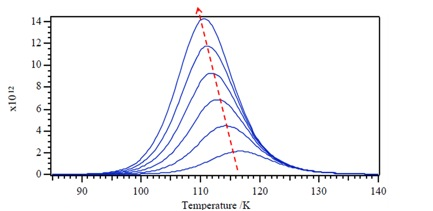
Now let consider a second-order desorption process [link] , with a rate constant k d . We can deduce the desorption kinetics as [link] . The result is different from the first-order reaction whose T m value does not depend upon the initial coverage, the temperature of the peak T m will decrease with increasing initial surface coverage.

A simulated second-order TPD experiment: A second-order reaction between adsorbates and surface. Values of T m decrease as the initial coverage θ increases from 1.0 x 10 13 to 6.0 x 10 13 cm -2 ; E a = 30 KJ/mol; β = 1.5 °C/s; A = 1 x 10 -1 .

Zero-order process

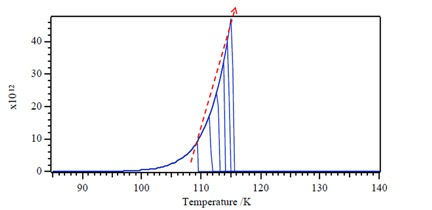
The zero-order desorption kinetics relationship as [link] . Looking at desorption rate for the zero-order reaction ( [link] ), we can observe that the desorption rate does not depend on coverage and also implies that desorption rate increases exponentially with T. Also according to the plot of desorption rate versus T, we figure out the desorption rate rapid drop when all molecules have desorbed. Plus temperature of peak, T m , moves to higher T with increasing coverage θ.

A simulated zero-order TPD experiment: A zero-order reaction between adsorbates and surface. Values of T m increase apparently as the initial coverage θ increases from 1.0 x 10 13 to 6.0 x 10 13 cm -2 ; E a = 30 KJ/mol; β = 1.5 °C/s; A = 1 x 10 28 .

A typical example

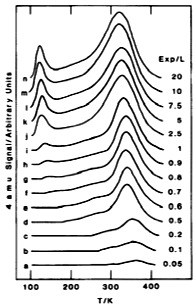
A typical TPD spectra of D 2 from Rh(100) for different exposures in Langmuirs (L = 10 -6 Torr-sec) shows in [link] . First we figure out the desorption peaks from g to n show two different desorbing regions. The higher one can undoubtedly be ascribed to chemisorbed D 2 on Rh(100) surface, which means chemisorbed molecules need higher energy used to overcome their activation energy for desorption. The lower desorption region is then due to physisorbed D 2 with much lower desorption activation energy than chemisorbed D 2 . According to the TPD theory we learnt, we notice that the peak maximum shifts to lower temperature with increasing initial coverage, which means it should belong to a second-order reaction. If we have other information about heating rate β and each T m under corresponding initial surface coverage θ then we are able to calculate the desorption activation energy E a and Arrhenius pre-exponential factor A.

TPD spectra of D 2 from Rh(100) for different exposures in L (1 Langmuir = 10 -6 Torr-s) 6 .

Conclusion

Temperature-programmed desorption is an easy and straightforward technique especially useful to investigate gas-solid interaction. By changing one of parameters, such as coverage or heating rate, followed by running a serious of typical TPD experiments, it is possible to to obtain several important kinetic parameters (activation energy to desorption, reaction order, pre-exponential factor, etc). Based on the information, further mechanism of gas-solid interaction can be deduced.

Bibliography

  • M. N. Roger, An Introduction to Surface Chemistry, (External Link)
  • P. L. Houston, Chemical Kinetics and Reaction Dynamics, McGraw Hill, New York (2001).
  • I. Langmuir, J. Am. Chem. Soc. , 1916, 38 , 221.
  • P. A. Redhead, Vacuum , 1962, 12 , 203.
  • Y. Kim, H. C. Peebles, and J. M. White, Surface Sci. , 1982, 114 , 363.

Questions & Answers

differentiate between demand and supply giving examples
Lambiv Reply
differentiated between demand and supply using examples
Lambiv
what is labour ?
Lambiv
how will I do?
Venny Reply
how is the graph works?I don't fully understand
Rezat Reply
information
Eliyee
devaluation
Eliyee
t
WARKISA
hi guys good evening to all
Lambiv
multiple choice question
Aster Reply
appreciation
Eliyee
explain perfect market
Lindiwe Reply
In economics, a perfect market refers to a theoretical construct where all participants have perfect information, goods are homogenous, there are no barriers to entry or exit, and prices are determined solely by supply and demand. It's an idealized model used for analysis,
Ezea
What is ceteris paribus?
Shukri Reply
other things being equal
AI-Robot
When MP₁ becomes negative, TP start to decline. Extuples Suppose that the short-run production function of certain cut-flower firm is given by: Q=4KL-0.6K2 - 0.112 • Where is quantity of cut flower produced, I is labour input and K is fixed capital input (K-5). Determine the average product of lab
Kelo
Extuples Suppose that the short-run production function of certain cut-flower firm is given by: Q=4KL-0.6K2 - 0.112 • Where is quantity of cut flower produced, I is labour input and K is fixed capital input (K-5). Determine the average product of labour (APL) and marginal product of labour (MPL)
Kelo
yes,thank you
Shukri
Can I ask you other question?
Shukri
what is monopoly mean?
Habtamu Reply
What is different between quantity demand and demand?
Shukri Reply
Quantity demanded refers to the specific amount of a good or service that consumers are willing and able to purchase at a give price and within a specific time period. Demand, on the other hand, is a broader concept that encompasses the entire relationship between price and quantity demanded
Ezea
ok
Shukri
how do you save a country economic situation when it's falling apart
Lilia Reply
what is the difference between economic growth and development
Fiker Reply
Economic growth as an increase in the production and consumption of goods and services within an economy.but Economic development as a broader concept that encompasses not only economic growth but also social & human well being.
Shukri
production function means
Jabir
What do you think is more important to focus on when considering inequality ?
Abdisa Reply
any question about economics?
Awais Reply
sir...I just want to ask one question... Define the term contract curve? if you are free please help me to find this answer 🙏
Asui
it is a curve that we get after connecting the pareto optimal combinations of two consumers after their mutually beneficial trade offs
Awais
thank you so much 👍 sir
Asui
In economics, the contract curve refers to the set of points in an Edgeworth box diagram where both parties involved in a trade cannot be made better off without making one of them worse off. It represents the Pareto efficient allocations of goods between two individuals or entities, where neither p
Cornelius
In economics, the contract curve refers to the set of points in an Edgeworth box diagram where both parties involved in a trade cannot be made better off without making one of them worse off. It represents the Pareto efficient allocations of goods between two individuals or entities,
Cornelius
Suppose a consumer consuming two commodities X and Y has The following utility function u=X0.4 Y0.6. If the price of the X and Y are 2 and 3 respectively and income Constraint is birr 50. A,Calculate quantities of x and y which maximize utility. B,Calculate value of Lagrange multiplier. C,Calculate quantities of X and Y consumed with a given price. D,alculate optimum level of output .
Feyisa Reply
Answer
Feyisa
c
Jabir
the market for lemon has 10 potential consumers, each having an individual demand curve p=101-10Qi, where p is price in dollar's per cup and Qi is the number of cups demanded per week by the i th consumer.Find the market demand curve using algebra. Draw an individual demand curve and the market dema
Gsbwnw Reply
suppose the production function is given by ( L, K)=L¼K¾.assuming capital is fixed find APL and MPL. consider the following short run production function:Q=6L²-0.4L³ a) find the value of L that maximizes output b)find the value of L that maximizes marginal product
Abdureman
types of unemployment
Yomi Reply
What is the difference between perfect competition and monopolistic competition?
Mohammed
Got questions? Join the online conversation and get instant answers!
Jobilize.com Reply

Get Jobilize Job Search Mobile App in your pocket Now!

Get it on Google Play Download on the App Store Now


Source:  OpenStax, Physical methods in chemistry and nano science. OpenStax CNX. May 05, 2015 Download for free at http://legacy.cnx.org/content/col10699/1.21
Google Play and the Google Play logo are trademarks of Google Inc.

Notification Switch

Would you like to follow the 'Physical methods in chemistry and nano science' conversation and receive update notifications?

Ask