

| << Chapter < Page | Chapter >> Page > |
Filter the sample solution by using a Pasteur pipette stuffed with a piece of cotton wool at the neck. Any suspended material like dust can cause changes in the spectrum. When working with dilute aqueous solutions, sweat itself can have a major effect and so gloves are recommended at all times.
The NMR probe is the most critical piece of equipment as it contains the apparatus that must detect the small NMR signals from the sample without adding a lot of noise. The size of the probe is given by the diameter of the NMR tube it can accommodate with common sizes 5, 10 and 15 mm. A larger size probe can be used in the case of less sensitive samples in order to get as much solute into the active zone as possible. When the sample is available in less quantity, use a smaller size tube to get an intrinsically higher sensitivity.
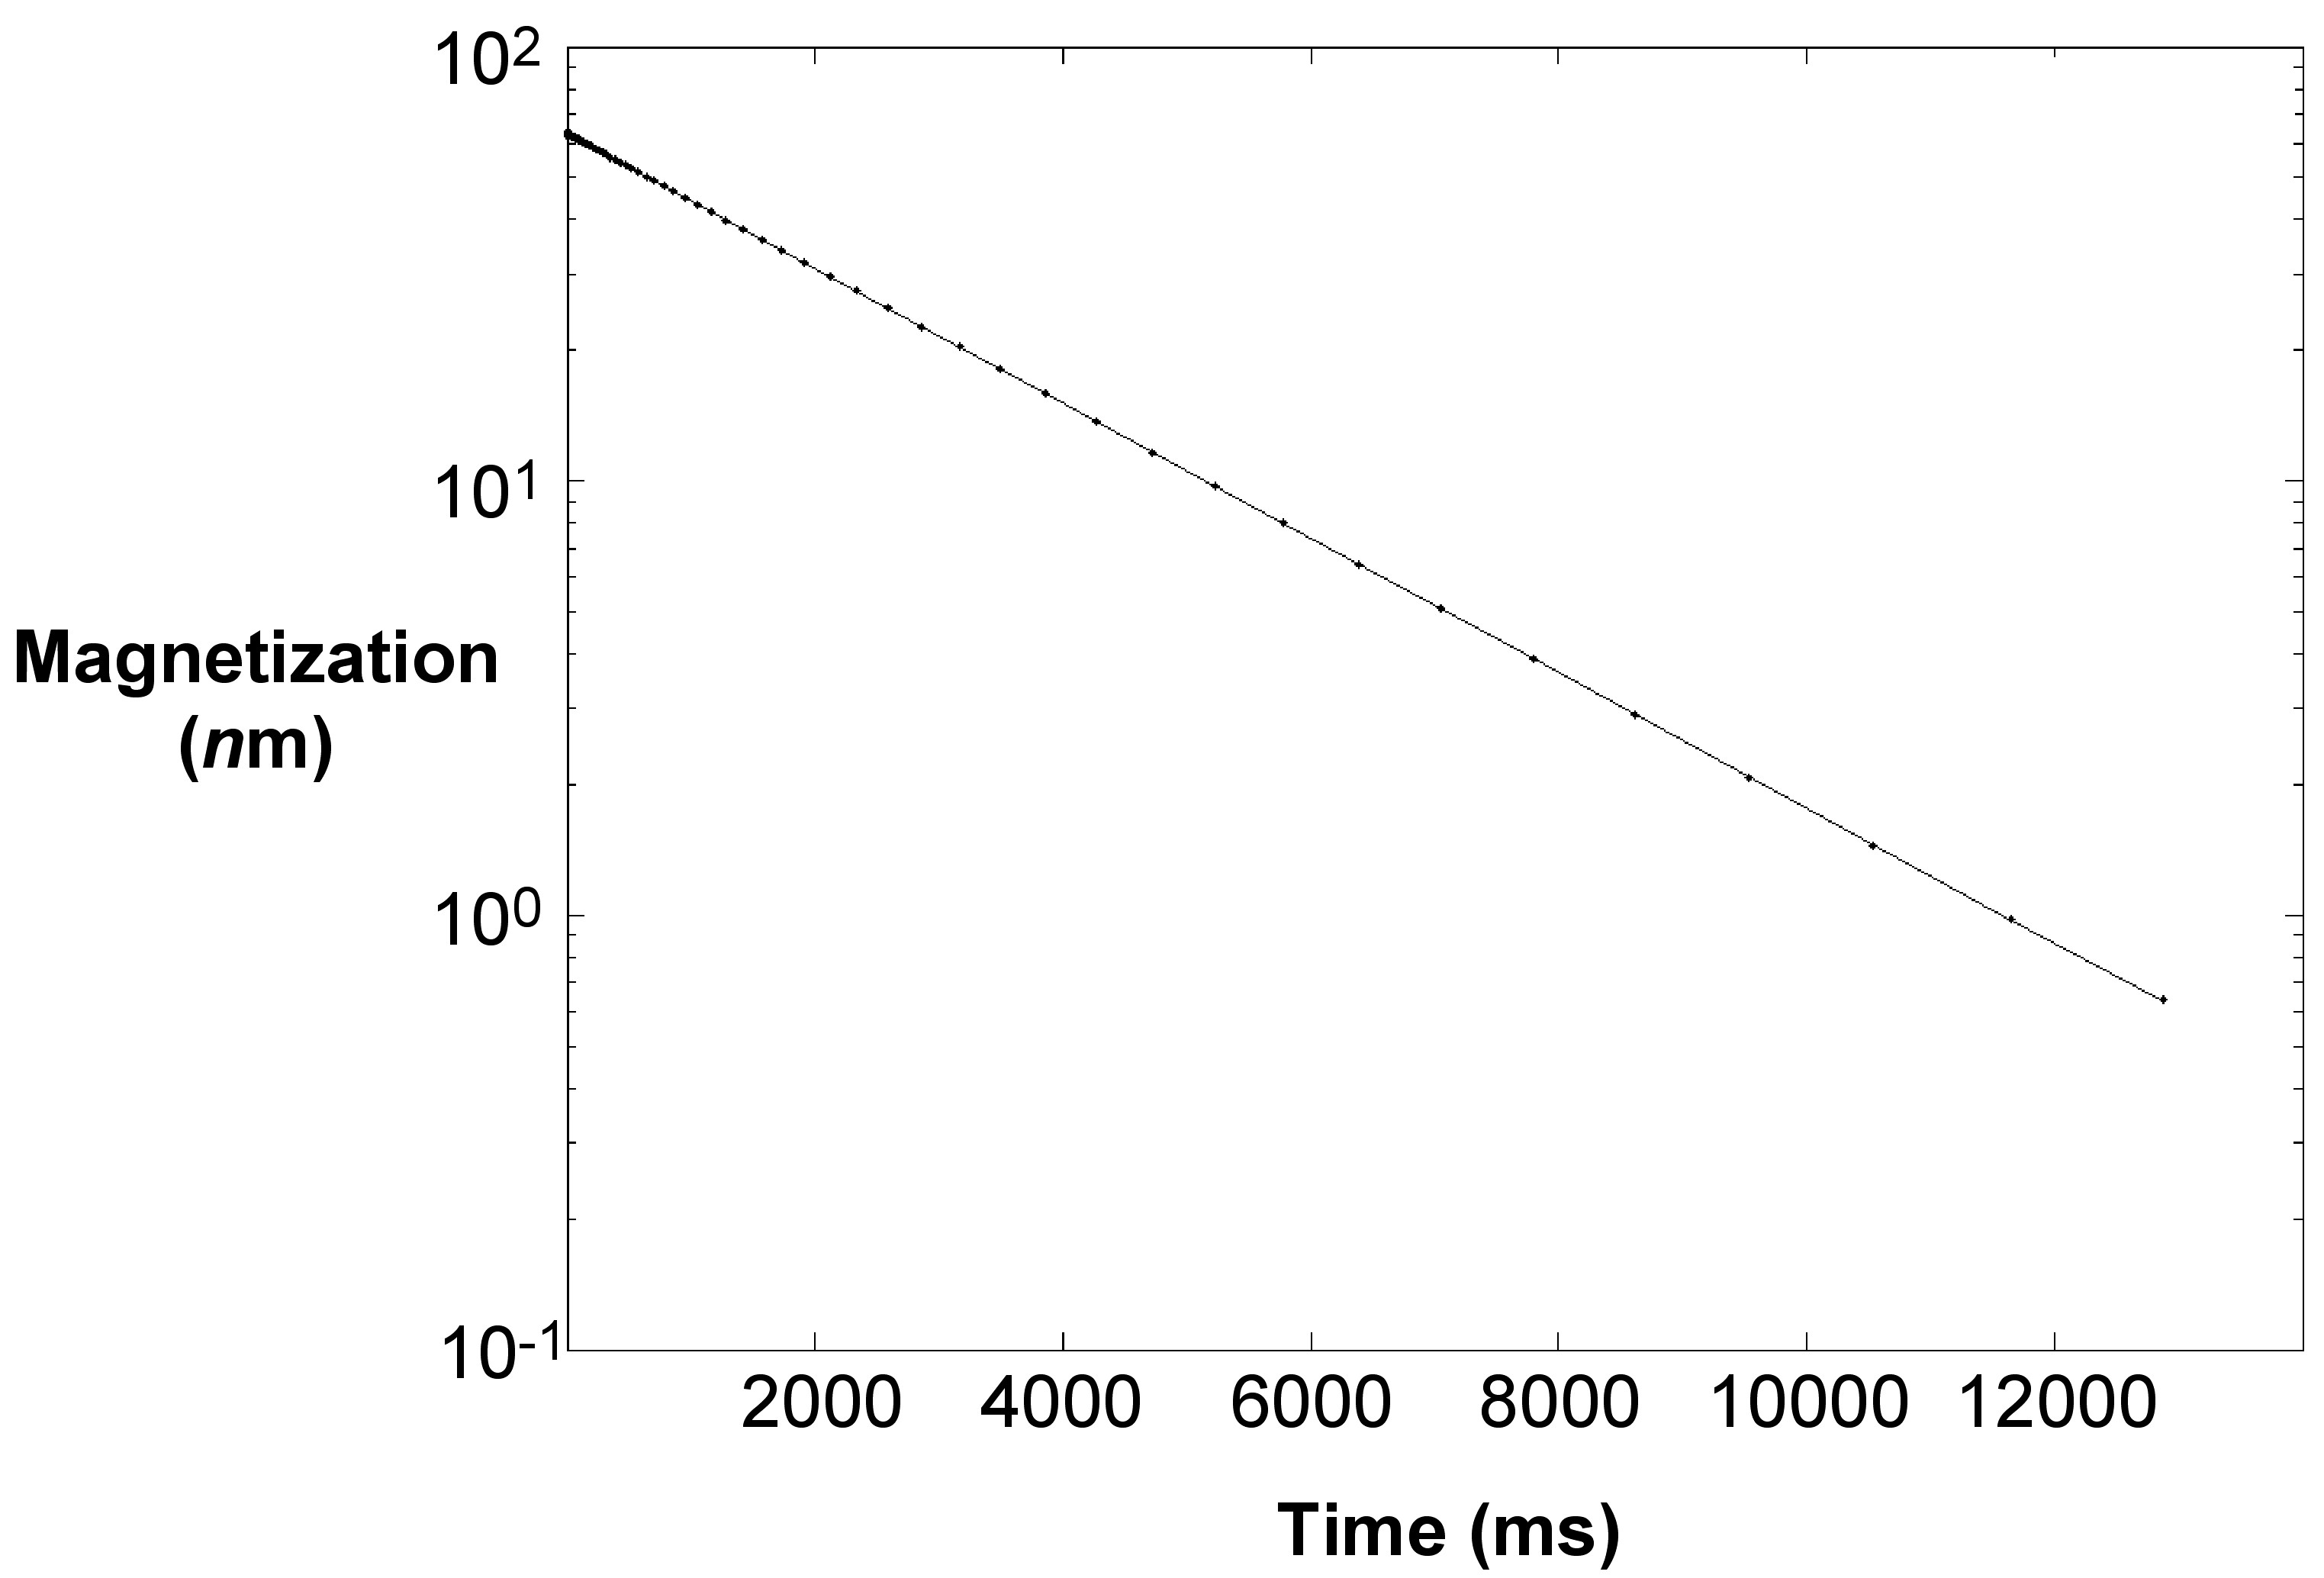
A result sheet of T 2 relaxation has the plot of magnetization versus time, which will be linear in a semi-log plot as shown in [link] . Fitting it to the equation, we can find T 2 and thus one can prepare a calibration plot of 1/T 2 versus S/V of known samples.
The following are a few of the limitations of the T 2 technique:
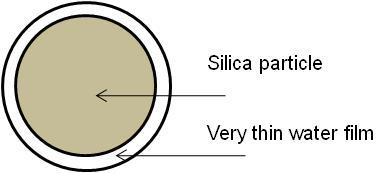
A study of colloidal silica dispersed in water provides a useful example. [link] shows a representation of an individual silica particle.
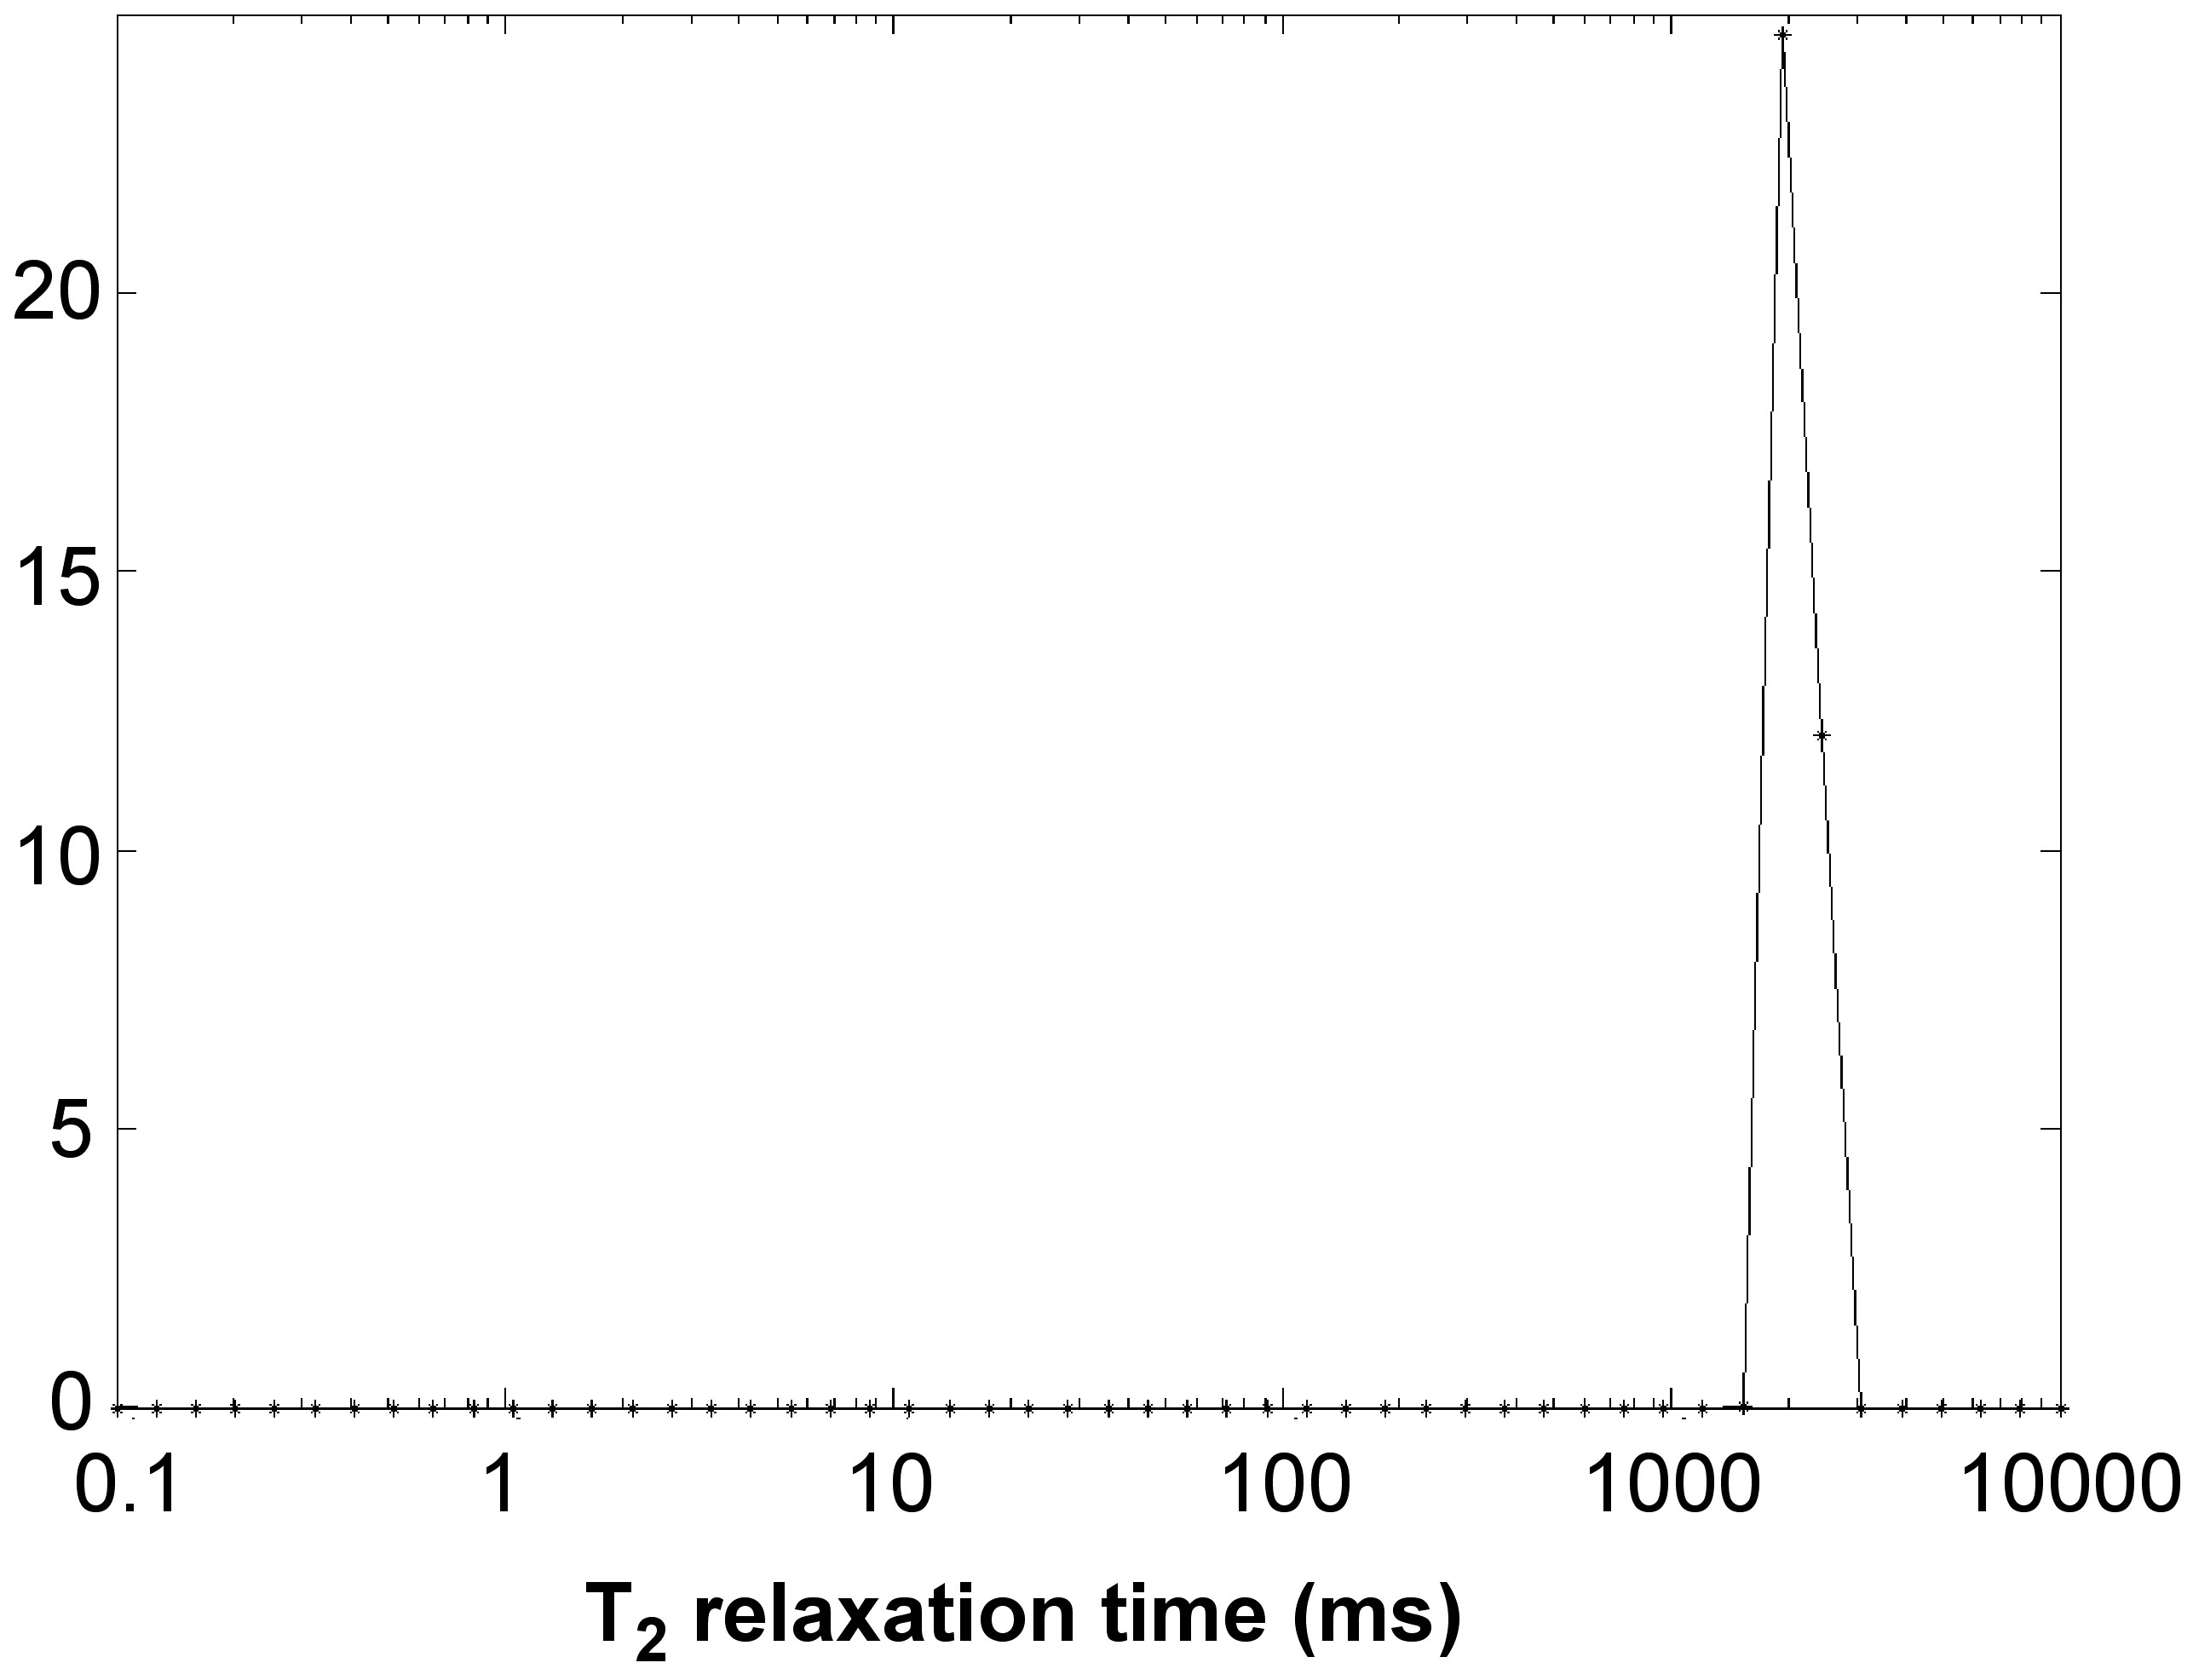
A series of dispersion in DI water at different concentrations was made and surface area calculated. The T 2 relaxation technique was performed on all of them with a typical T 2 plot shown in [link] and T 2 was recorded at 2117 milliseconds for this sample.
A calibration plot was prepared with 1/T 2 – 1/T 2,bulk as ordinate (the y -axis coordinate) and S/V as abscissa (the x -axis coordinate). This is called the surface relaxivity plot and is illustrated in [link] .
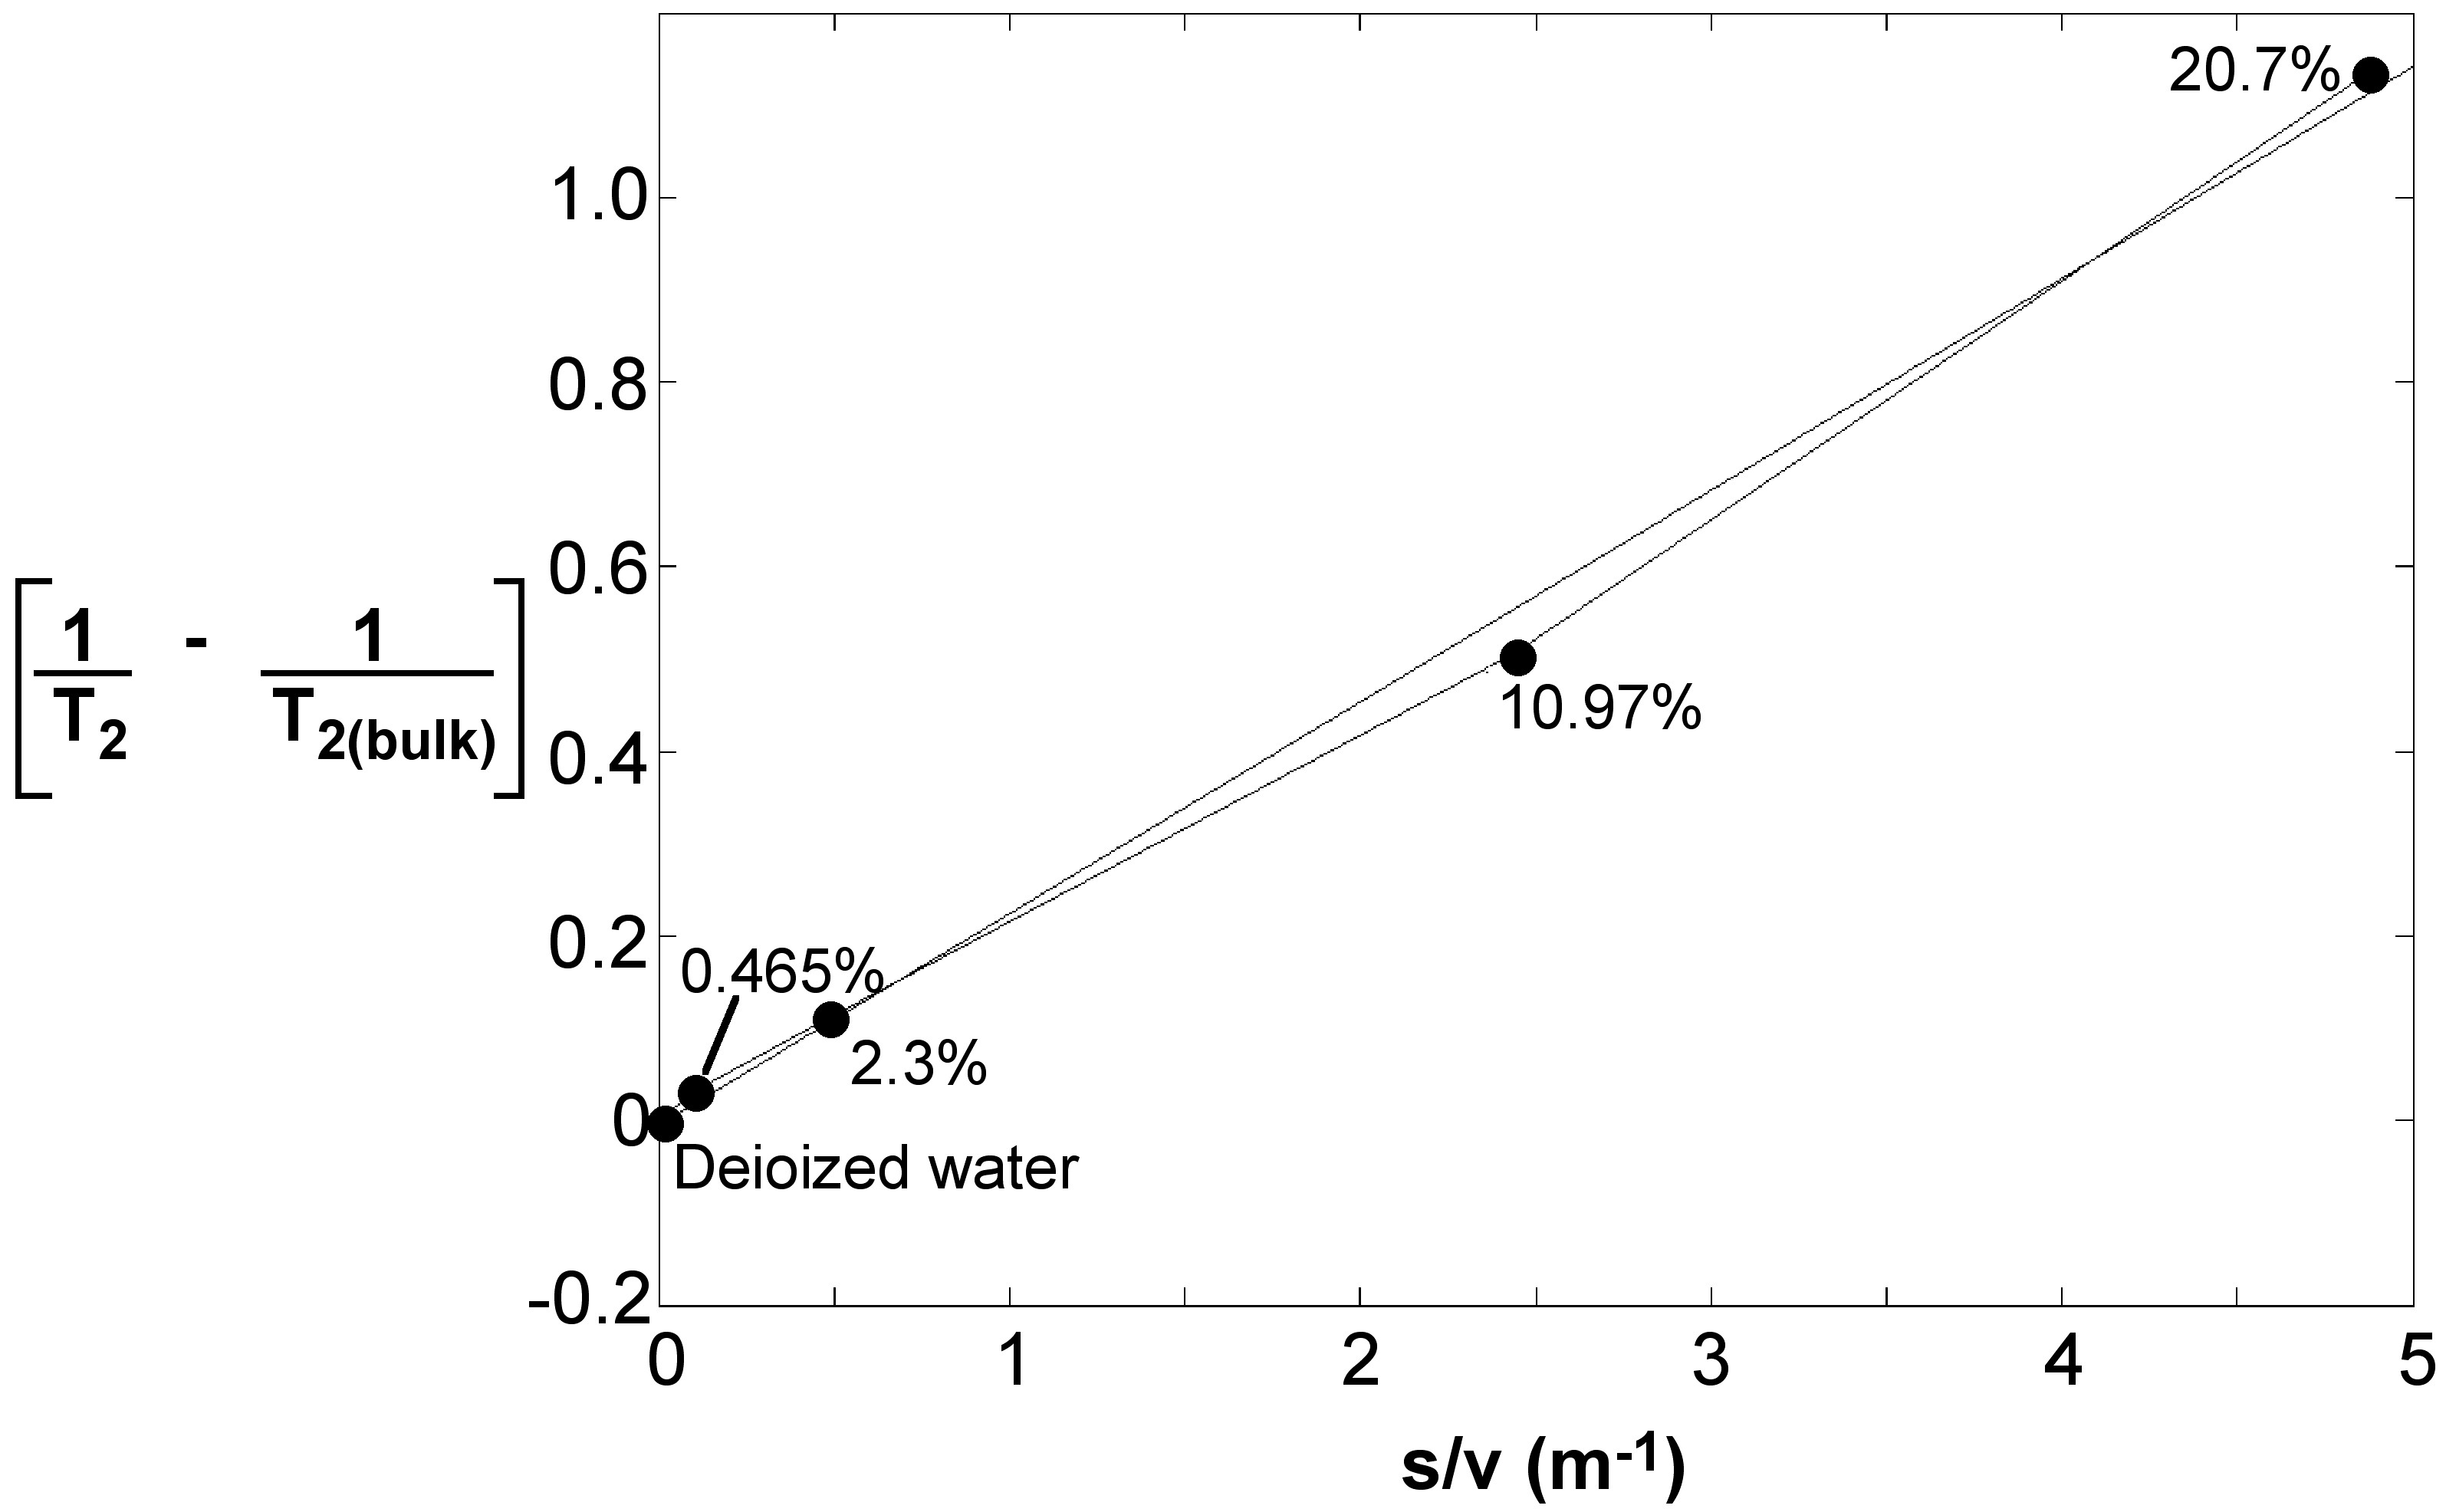
Accordingly for the colloidal dispersion of silica in DI water, the best fit resulted in [link] , from which one can see that the value of surface relaxivity, 2.3 x 10 -8 , is in close accordance with values reported in literature.
The T 2 technique has been used to find the pore-size distribution of water-wet rocks. Information of the pore size distribution helps petroleum engineers model the permeability of rocks from the same area and hence determine the extractable content of fluid within the rocks.
Usage of NMR for surface area determination has begun to take shape with a company, Xigo nanotools, having developed an instrument called the Acorn Area TM to get surface area of a suspension of aluminum oxide. The results obtained from the instrument match closely with results reported by other techniques in literature. Thus the T 2 NMR technique has been presented as a strong case to obtain specific surface areas of nanoparticle suspensions.
Notification Switch
Would you like to follow the 'Physical methods in chemistry and nano science' conversation and receive update notifications?

|
|
|
|
|

|
|

|
|
|
|
|

|
|

|
|

|
|

|
|

|