

| << Chapter < Page | Chapter >> Page > |
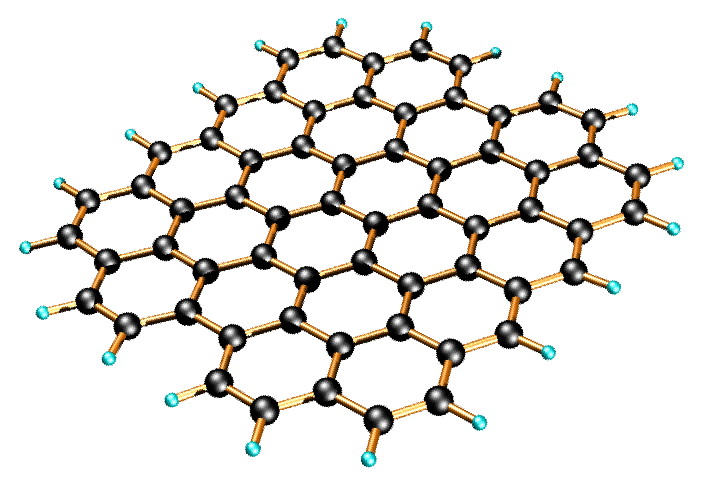
Graphene is a quasi-two-dimensional material, which comprises layers of carbon atoms arranged in six-member rings ( [link] ). Since being discovered by Andre Geim and co-wokers at the University of Manchester, graphene has become one of the most exciting topics of research because of its distinctive band structure and physical properties, such as the observation of a quantum hall effect at room temperature, a tunable band gap, and a high carrier mobility.
Graphene can be characterized by many techniques including atomic force microscopy (AFM), transmission electron microscopy (TEM) and Raman spectroscopy. AFM can be used to determine the number of the layers of the graphene, and TEM images can show the structure and morphology of the graphene sheets. In many ways, however, Raman spectroscopy is a much more important tool for the characterization of graphene. First of all, Raman spectroscopy is a simple tool and requires little sample preparation. What’s more, Raman spectroscopy can not only be used to determine the number of layers, but also can identify if the structure of graphene is perfect, and if nitrogen, hydrogen or other fuctionalization is successful.
While Raman spectroscopy is a useful technique for characterizing sp 2 and sp 3 hybridized carbon atoms, including those in graphite, fullerenes, carbon nanotubes, and graphene. Single, double, and multi-layer graphenes have also been differentiated by their Raman fingerprints.
[link] shows a typical Raman spectrum of N-doped single-layer graphene. The D-mode, appears at approximately 1350 cm-1, and the G-mode appears at approximately 1583 cm -1 . The other Raman modes are at 1620 cm -1 (D’- mode), 2680 cm -1 (2D-mode), and 2947 cm -1 (D+G-mode).
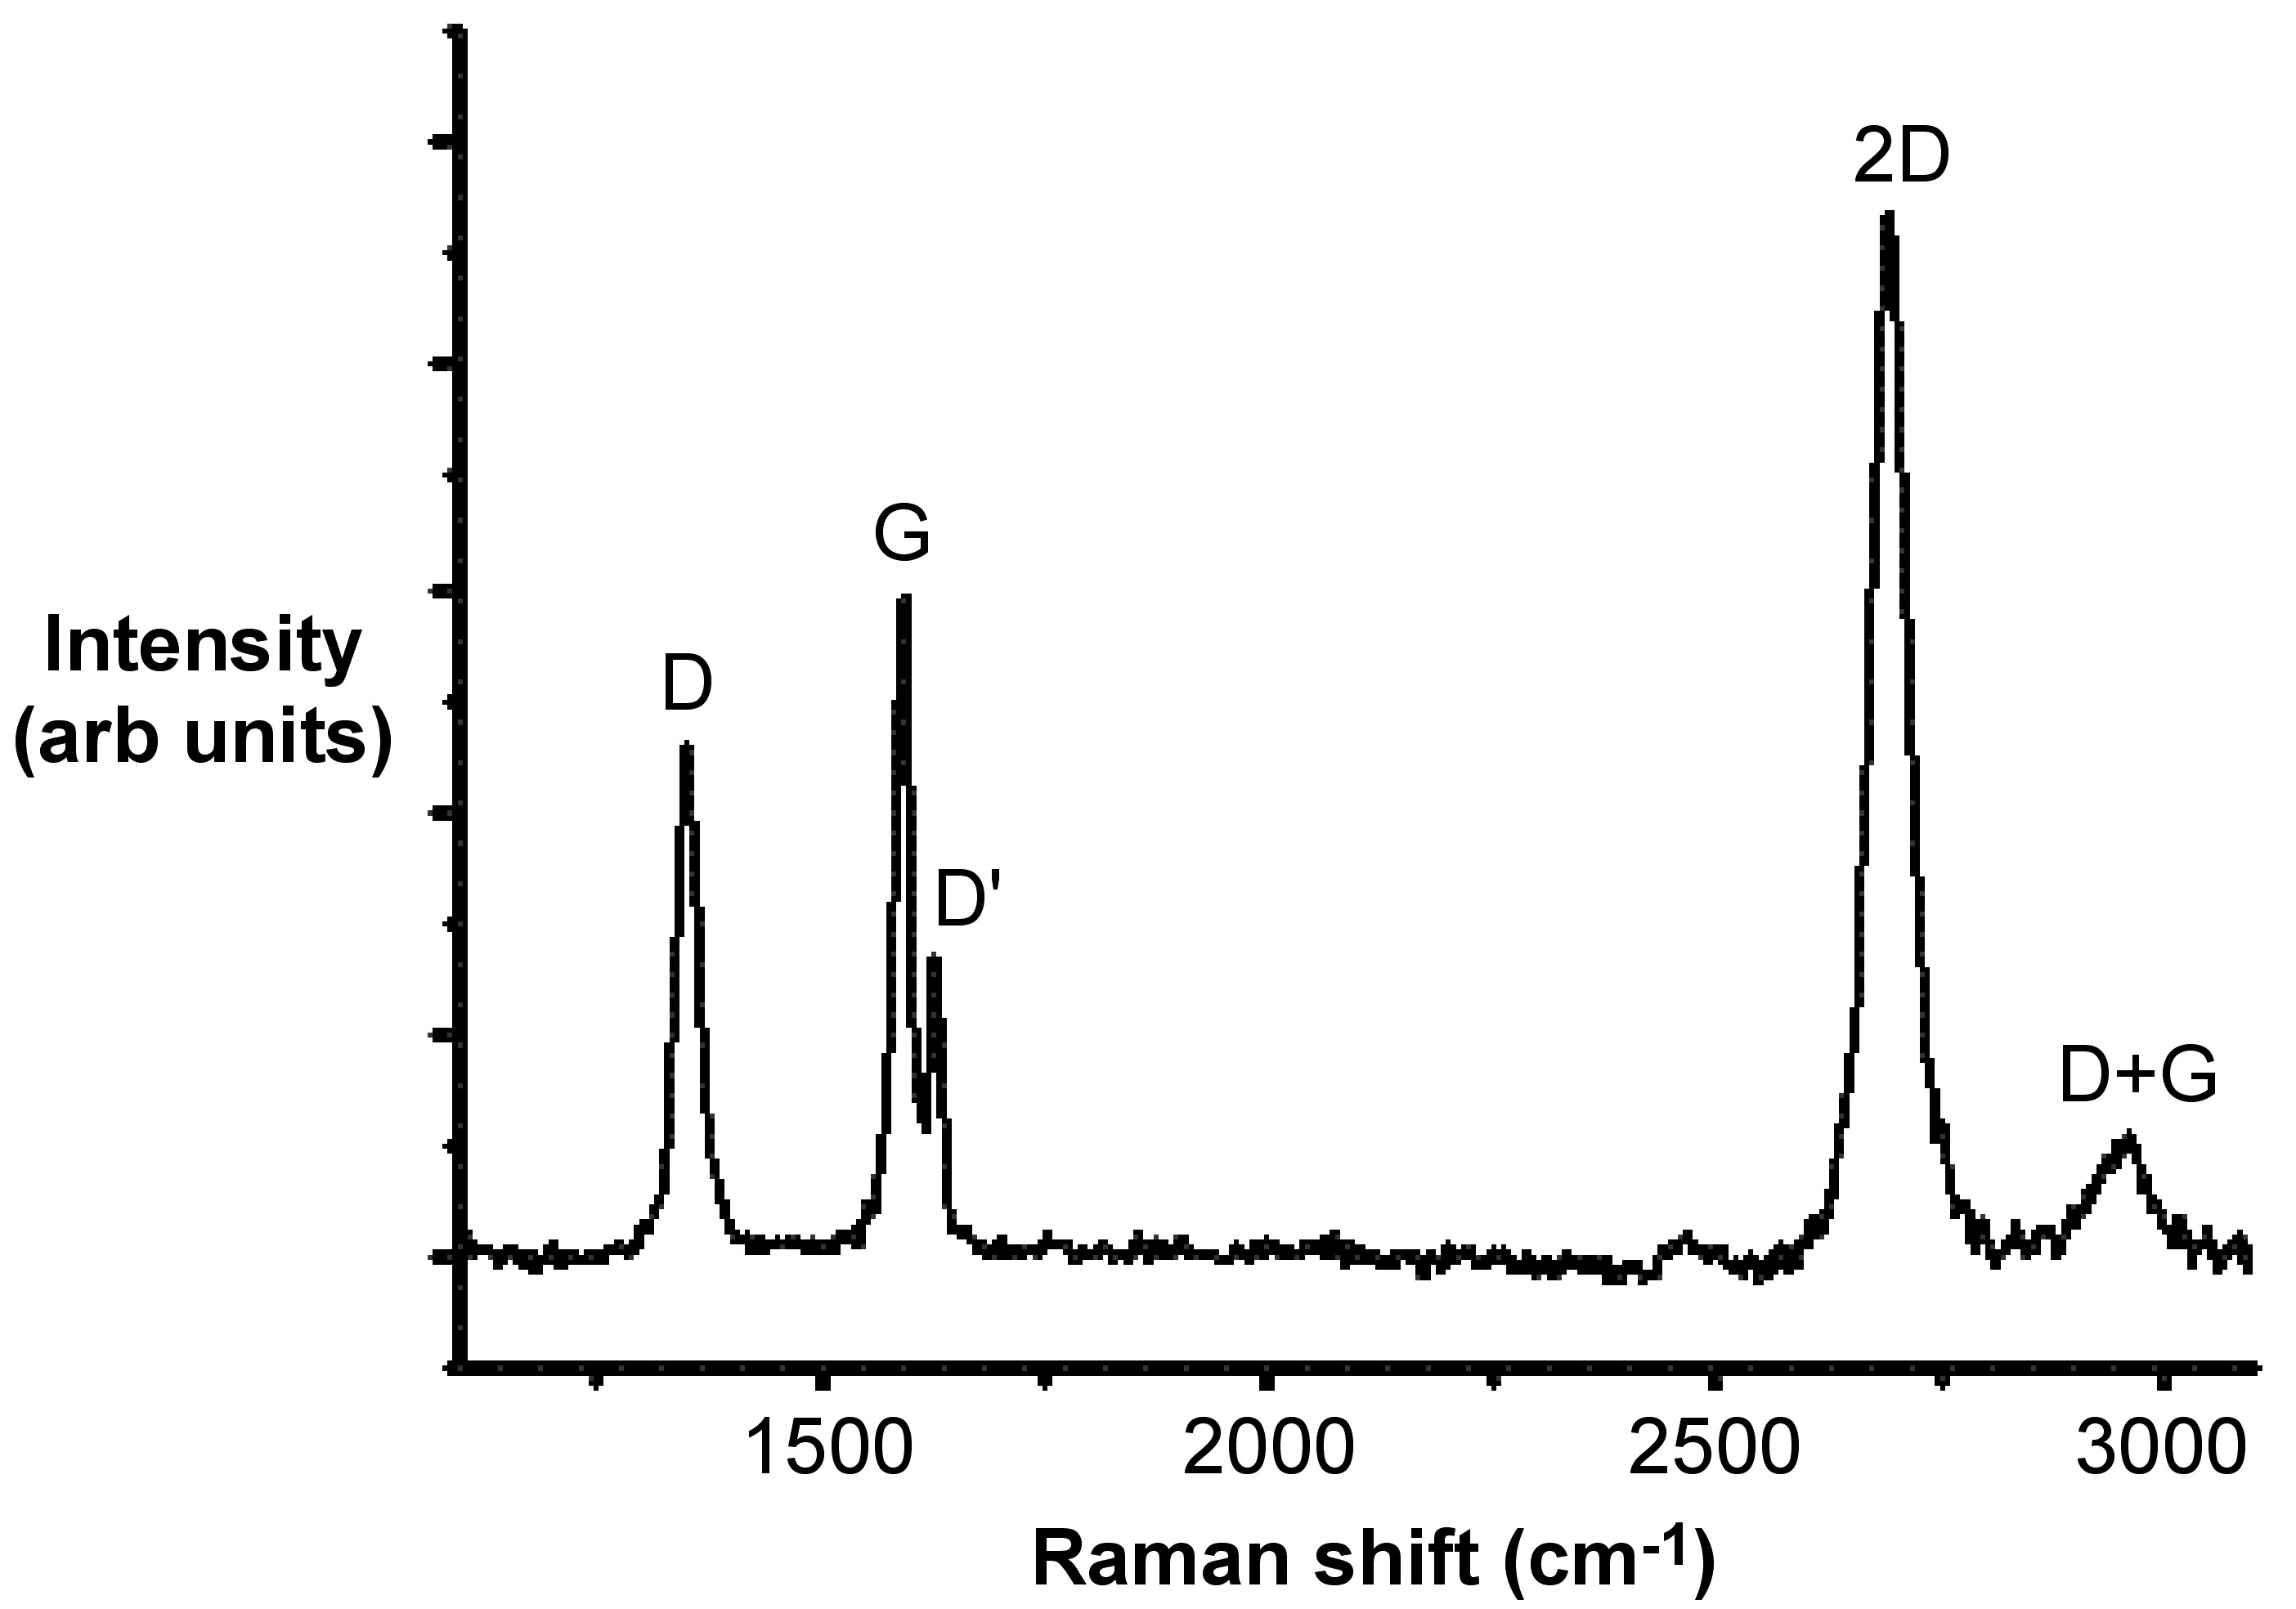
The G-mode is at about 1583 cm -1 , and is due to E2g mode at the Γ-point. G-band arises from the stretching of the C-C bond in graphitic materials, and is common to all sp 2 carbon systems. The G-band is highly sensitive to strain effects in sp 2 system, and thus can be used to probe modification on the flat surface of graphene.
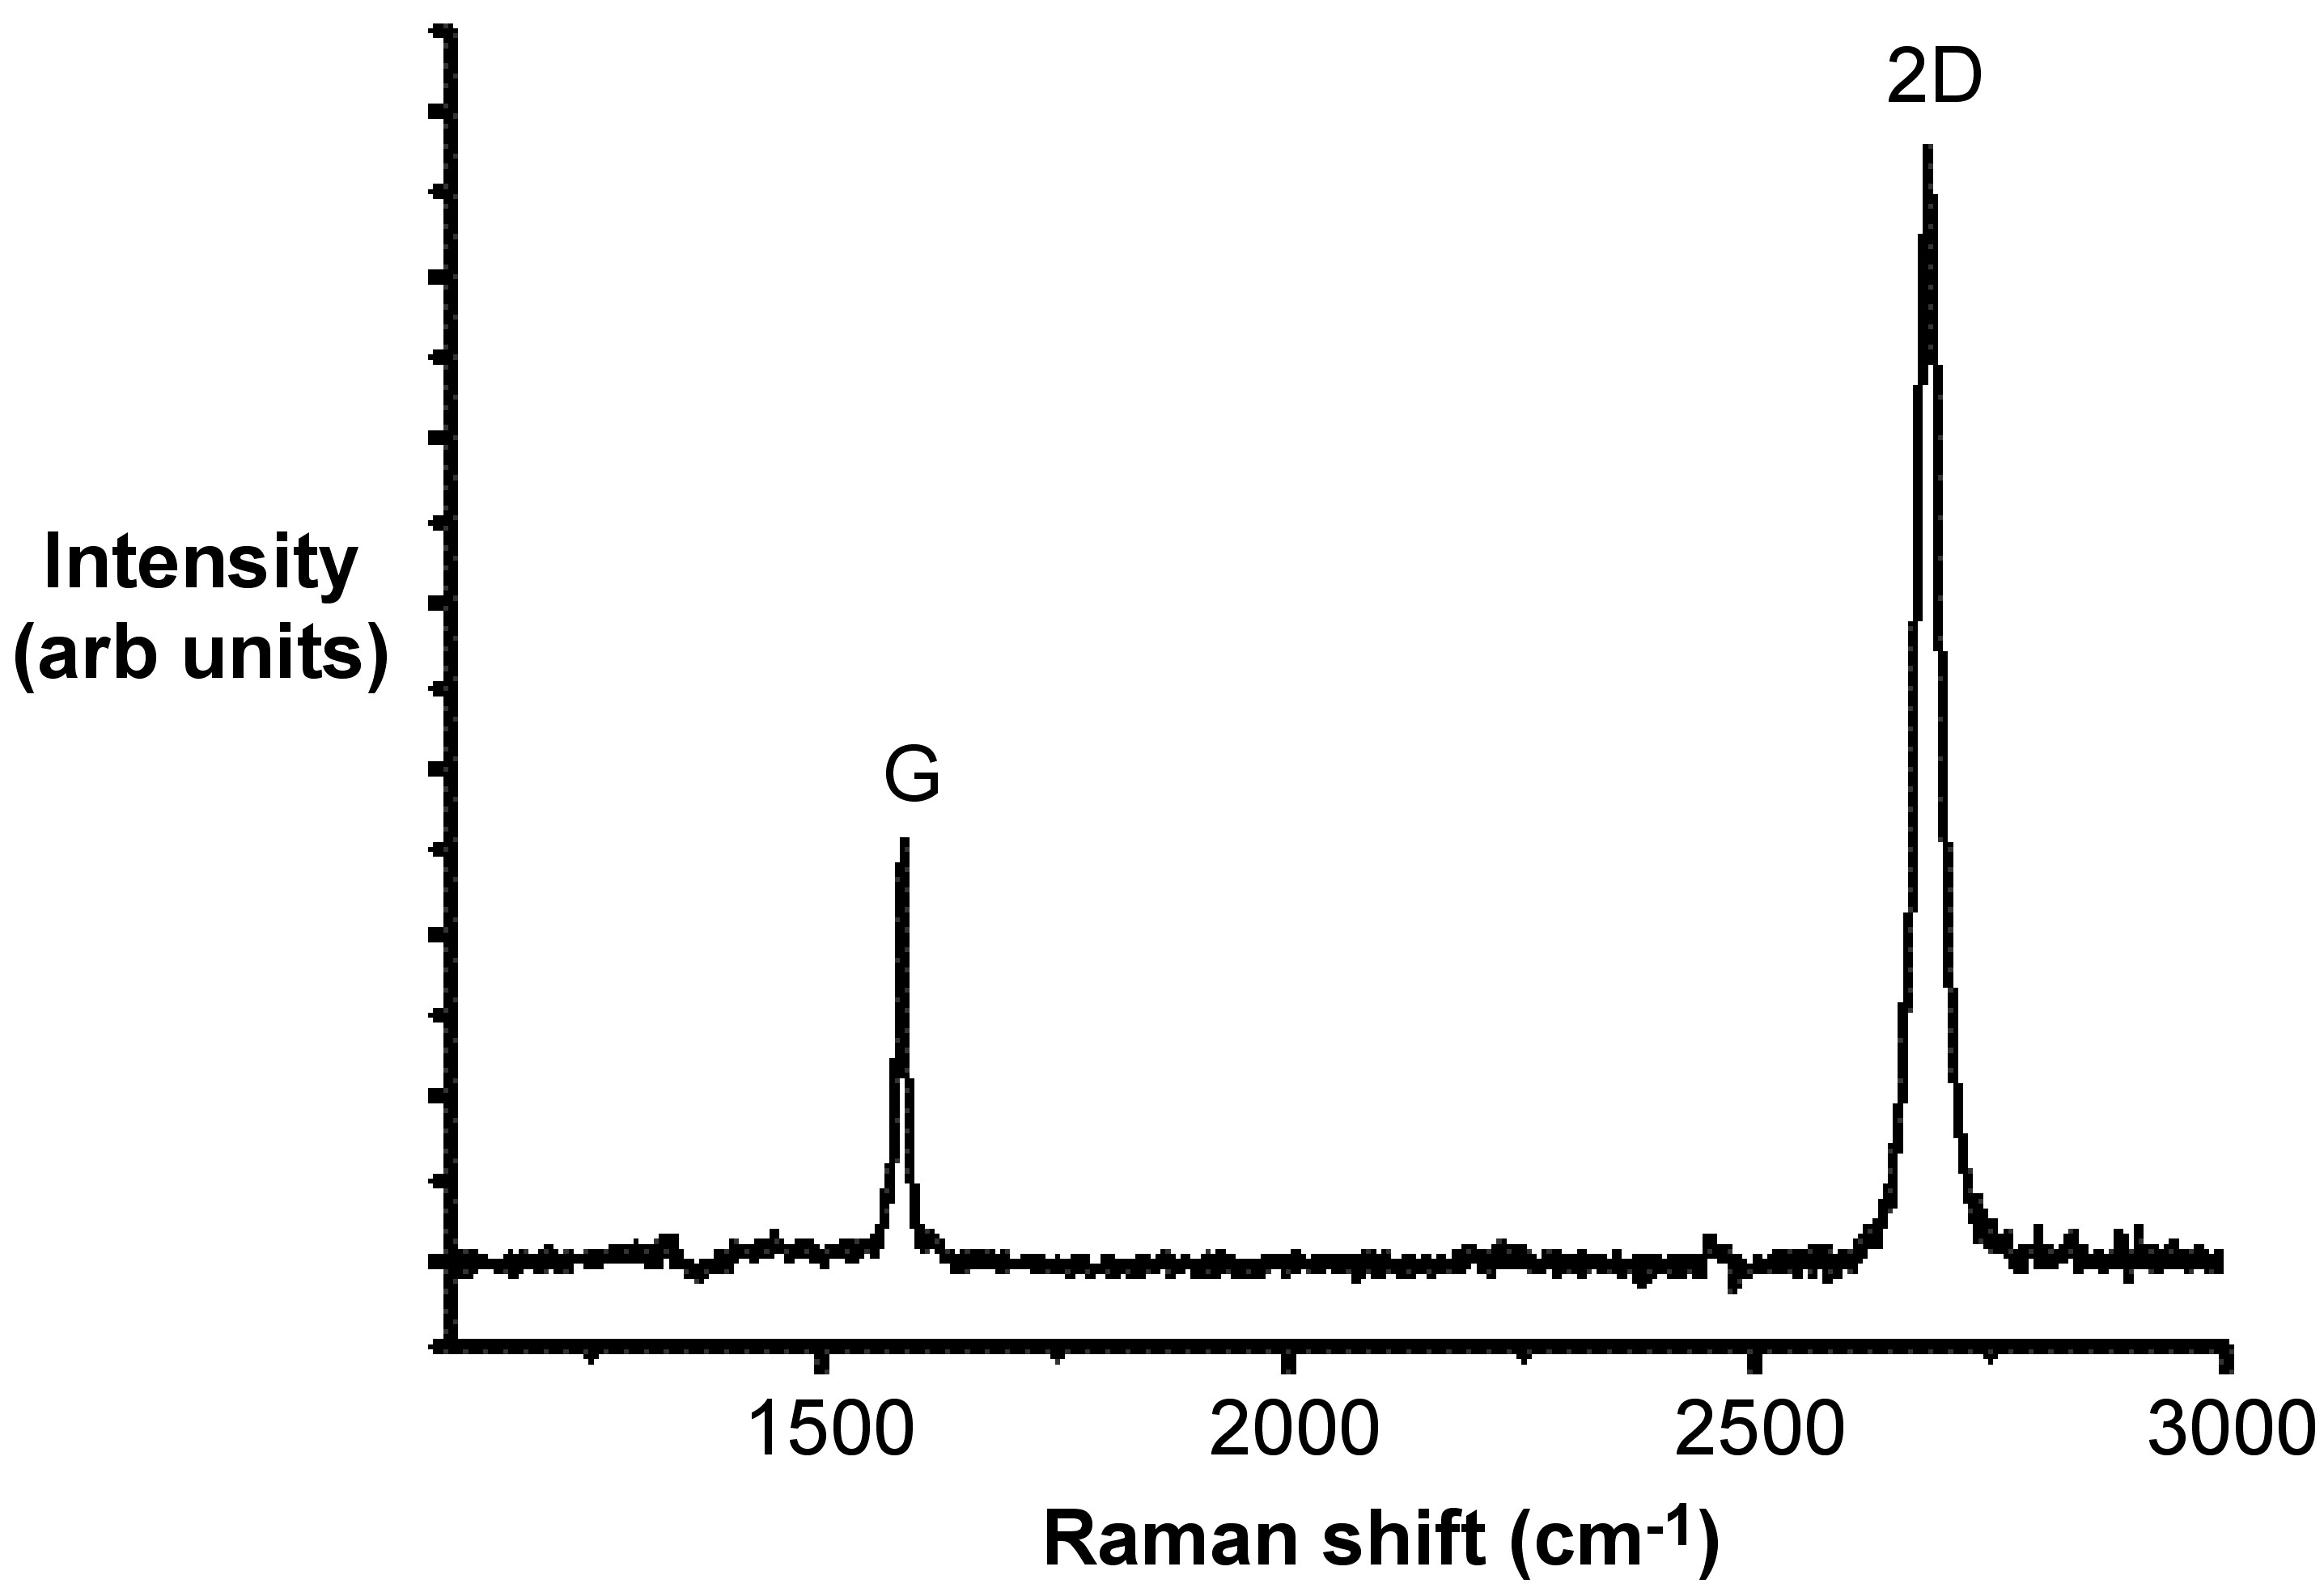
The D-mode is caused by disordered structure of graphene. The presence of disorder in sp 2 -hybridized carbon systems results in resonance Raman spectra, and thus makes Raman spectroscopy one of the most sensitive techniques to characterize disorder in sp 2 carbon materials. As is shown by a comparison of [link] and [link] , there is no D peak in the Raman spectra of graphene with a perfect structure.
If there are some randomly distributed impurities or surface charges in the graphene, the G-peak can split into two peaks, G-peak (1583 cm -1 ) and D’-peak (1620 cm -1 ). The main reason is that the localized vibrational modes of the impurities can interact with the extended phonon modes of graphene resulting in the observed splitting.
All kinds of sp 2 carbon materials exhibit a strong peak in the range 2500 - 2800 cm -1 in the Raman spectra. Combined with the G-band, this spectrum is a Raman signature of graphitic sp 2 materials and is called 2D-band. 2D-band is a second-order two-phonon process and exhibits a strong frequency dependence on the excitation laser energy.
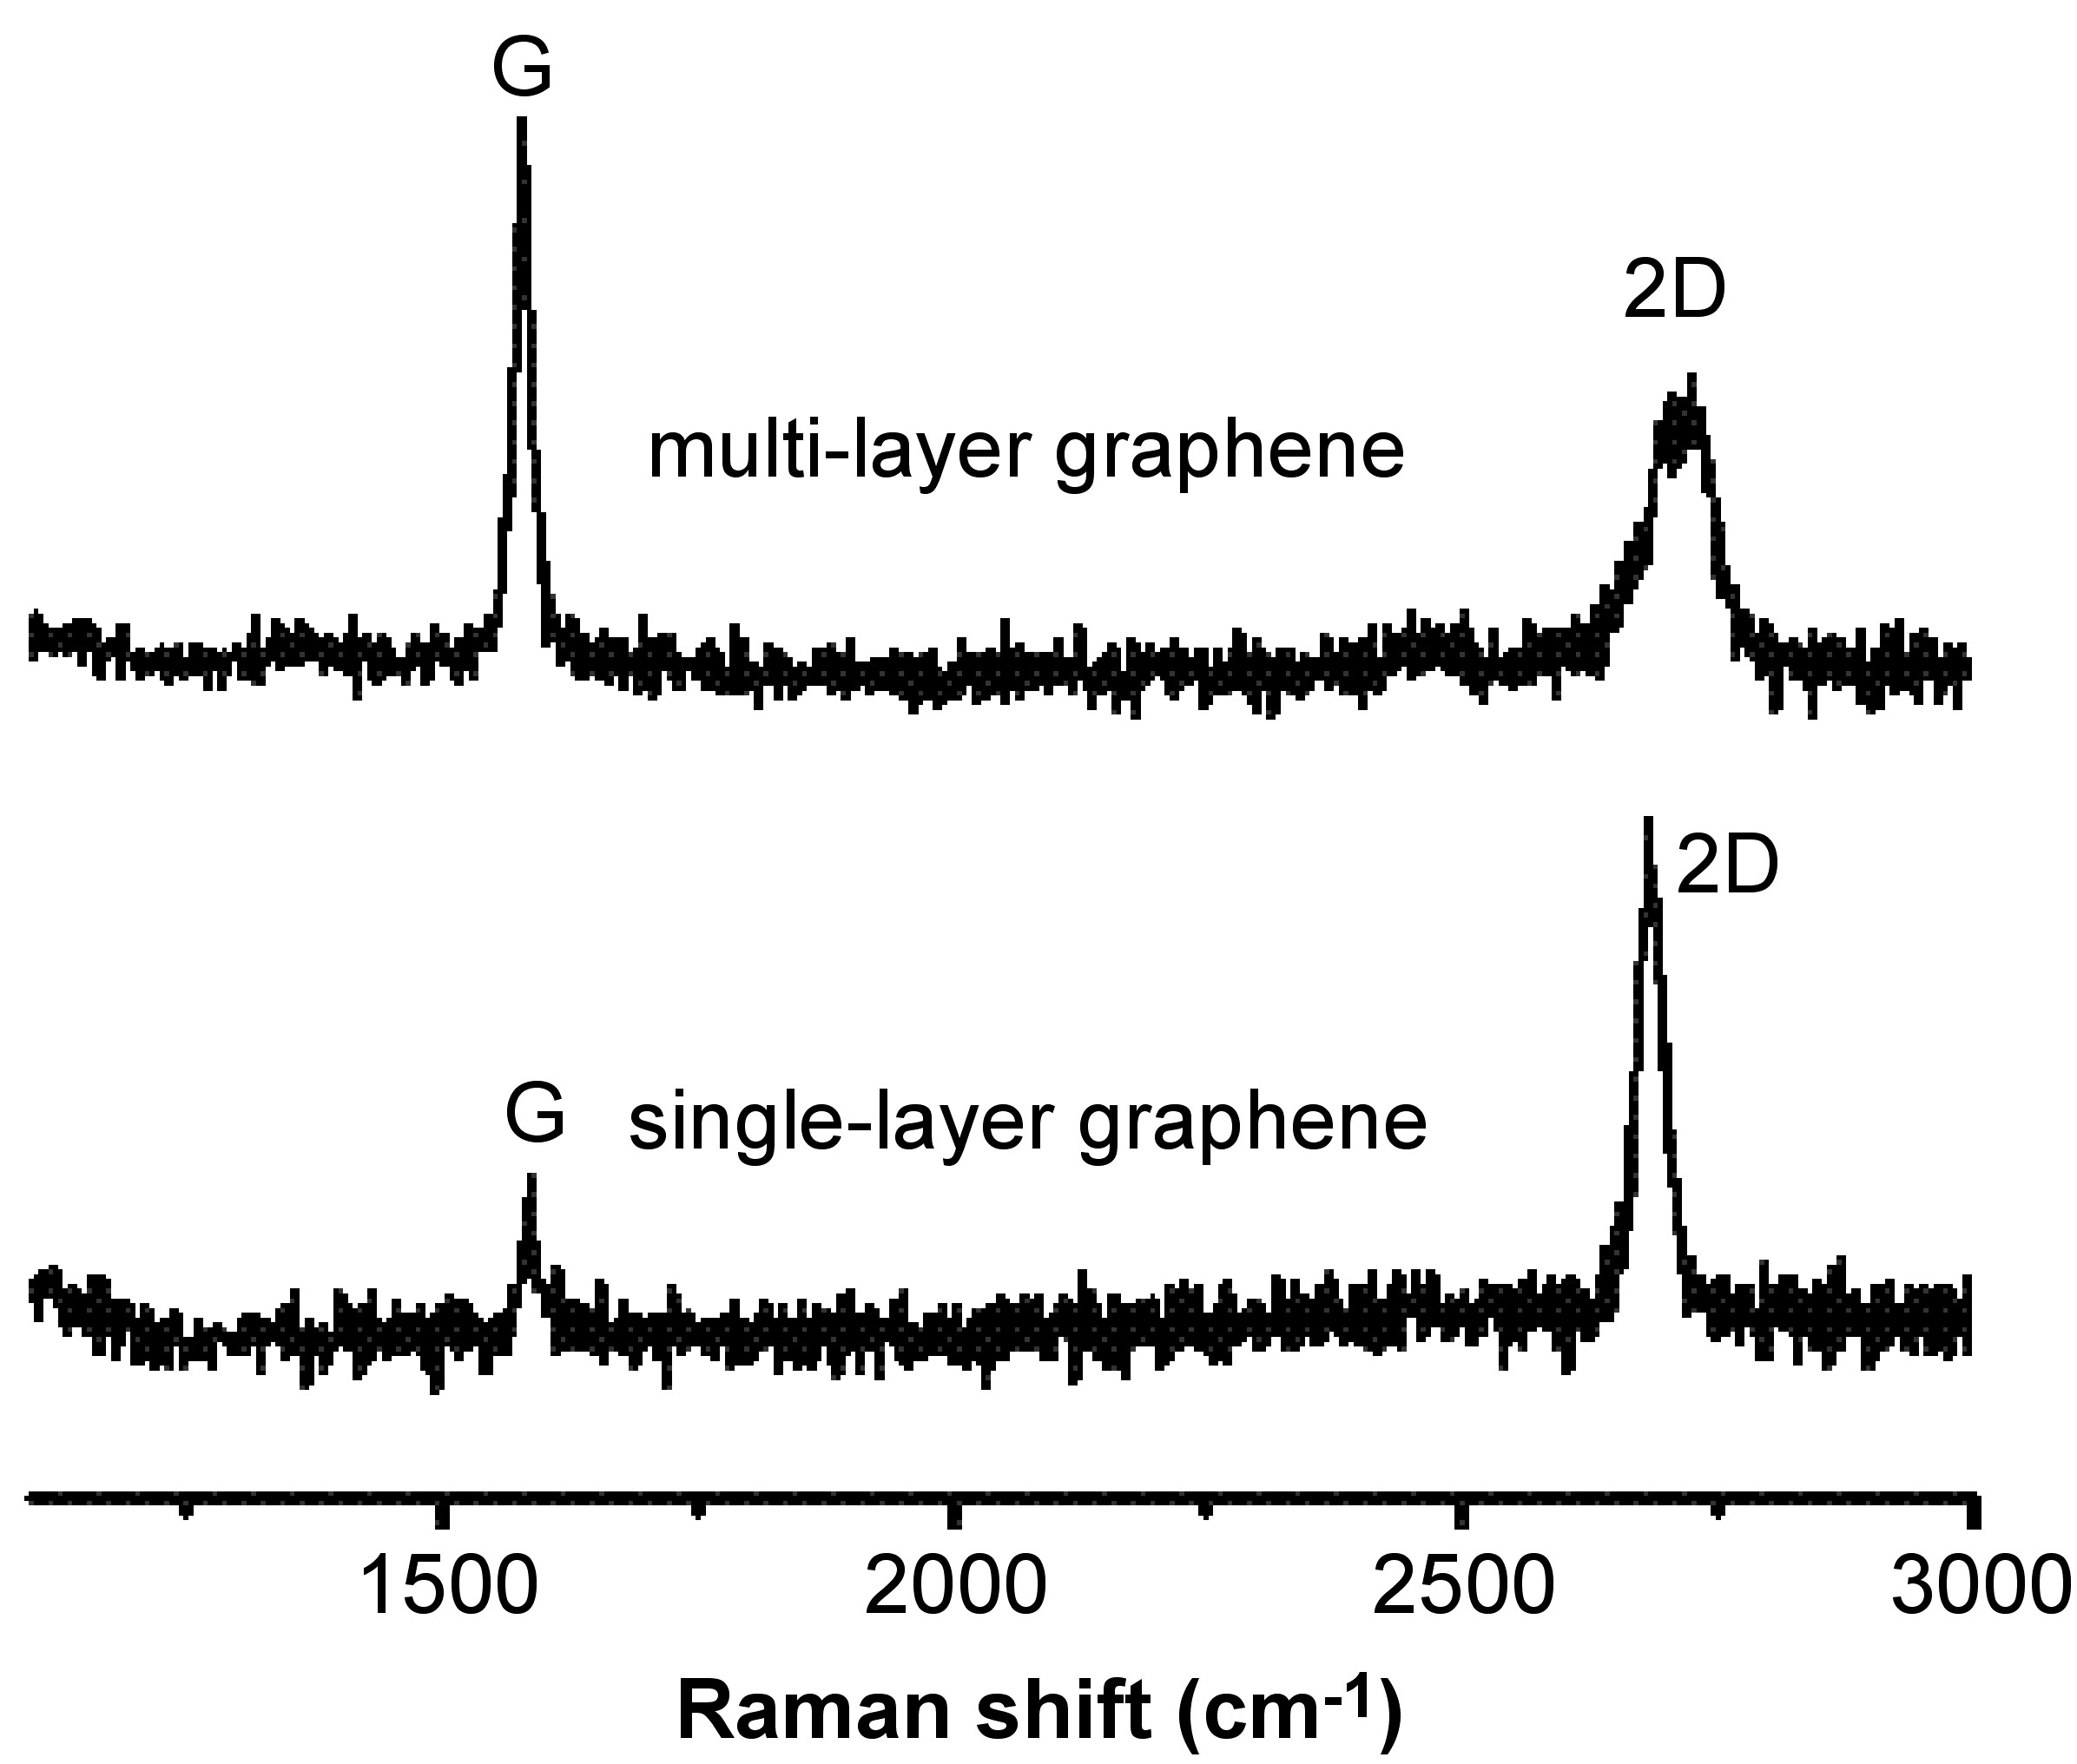
What’s more, the 2D band can be used to determine the number of layer of graphene. This is mainly because in the multi-layer graphene, the shape of 2D band is pretty much different from that in the single-layer graphene. As shown in [link] , the 2D band in the single-layer graphene is much more intense and sharper as compared to the 2D band in multi-layer graphene.
Notification Switch
Would you like to follow the 'Physical methods in chemistry and nano science' conversation and receive update notifications?

|
|

|
|

|
|

|
|

|
|

|
|

|
|

|
|

|
|
|
|