

| << Chapter < Page | Chapter >> Page > |
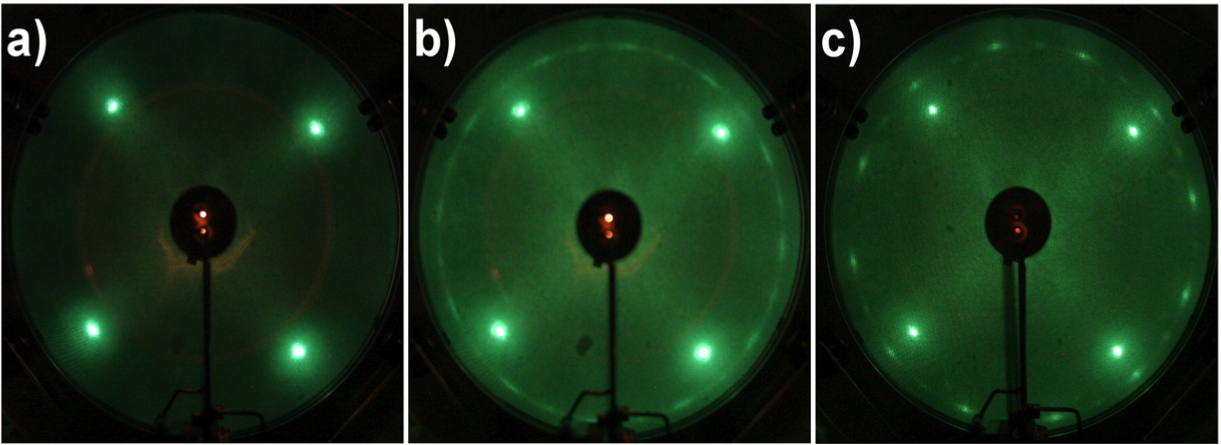
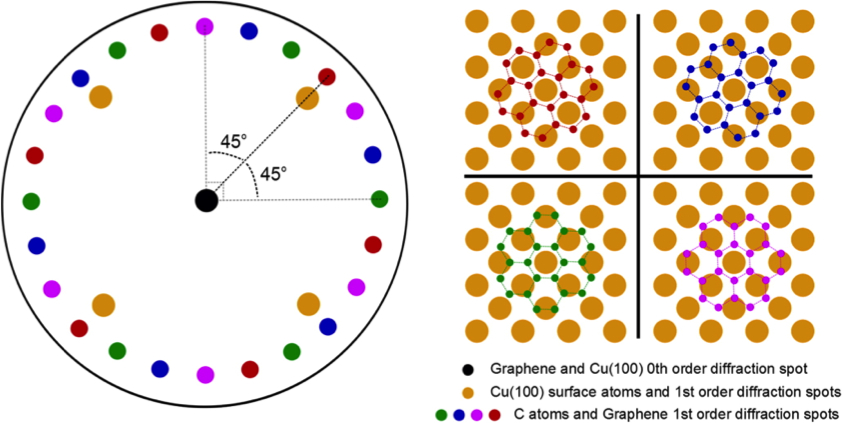
[link] b shows the LEED pattern after the growth of graphene on the surface of Cu (100) at 800 °C, we can observe the four spots that correspond to the surface of Cu (100) and a ring just outside these spots, which correspond to the domains of graphene with four different primary rotational alignments with respect to the Cu (100) substrate lattice, see [link] . When increasing the temperature of growth of graphene to 900 °C, we can observe a ring of twelve spots (as seen in [link] c), which indicates that the graphene has a much higher degree of rotational order. Only two domains are observed with an alignment of one of the lattice vectors to one of the Cu (100) surface lattice vectors, given that graphene has a hexagonal geometry, so that only one vector can coincide with the cubic lattice of Cu (100).
One possible explanation for the twelve spots observed at 900 ˚C is that when the temperature of all domains is increased the four different domains observed at 800 ˚C, may possess enough energy to adopt the two orientations in which the vectors align with the surface lattice vector of Cu (100). In addition, at 900 ˚C, a decrease in the size and intensity of the Cu (100) spots is observed, indicating a larger coverage of the copper surface by the domains of graphene.
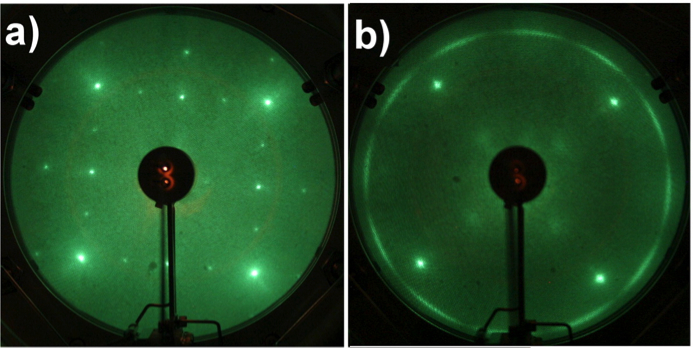
When the oxygen is chemisorbed on the surface of Cu (100), the new spots correspond to oxygen, [link] a. Once graphene is allowed to grow on the surface with oxygen at 900 ˚C, the LEED pattern turns out different: the twelve spots corresponding to graphene domains are not observed due to nucleation of graphene domains in the presence of oxygen in multiple orientations, [link] b.
A way to study the disorder of the adsorbed layers is through the LEED–IV curves, see [link] . In this case, the intensities are in relation to the angle of the electron beam. The spectrum of Cu (100) with only four sharp peaks shows a very organized surface. In the case of the graphene sample growth over the copper surface, twelve peaks are shown, which correspond to the main twelve spots of the LEED pattern. These peaks are sharp, which indicate an high level of order. For the case of the sample of graphene growth over copper with oxygen, the twelve peaks widen, which is an effect of the increase of disorder in the layers.
Notification Switch
Would you like to follow the 'Physical methods in chemistry and nano science' conversation and receive update notifications?

|
|

|
|

|
|

|
|

|
|
|
|
|

|
|

|
|

|
|

|