

| << Chapter < Page | Chapter >> Page > |
According to the Langmuir model, we know that the adsorption rate should be proportional to k a [A](1-θ), where θ is the fraction of the surface sites covered by adsorbate A. The desorption rate is then proportional to k d θ. k a and k d are the rate constants for the adsorption and desorption. At equilibrium, the rates of these two processes are equal, [link] - [link] . We can replace [A] by P, where P means the gas partial pressure, [link] .
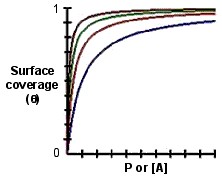
We can observe the equation above and know that if [A] or P is low enough so that K[A]or KP<<1, then θ ~ K[A] or KP, which means that the surface coverage should increase linearly with [A]or P. On the contrary, if [A] or P is large enough so that K[A]or KP>>1, then θ ~ 1. This behavior is shown in the plot of θ versus [A] or P in [link] .
Here we are going to show how to use the TPD technique to estimate desorption energy, reaction energy, as well as Arrhenius pre-exponential factor. Let us assume that molecules are irreversibly adsorbed on the surface at some low temperature T 0 . The leak valve is closed, the valve to the pump is opened, and the “density” of product molecules is monitored with a mass spectrometer as the crystal is heated under programmed temperature [link] , where β is the heating rate (~10 °C/s). We know the desorption rate depends strongly on temperature, so when the temperature of the crystal reaches a high enough value so that the desorption rate is appreciable, the mass spectrometer will begin to record a rise in density. At higher temperatures, the surface will finally become depleted of desorbing molecules; therefore, the mass spectrometer signal will decrease. According to the shape and position of the peak in the mass signal, we can learn about the activation energy for desorption and the Arrhenius pre-exponential factor.
Consider a first-order desorption process [link] , with a rate constant k d , [link] , where A is Arrhenius pre-exponential factor. If θ is assumed to be the number of surface adsorbates per unit area, the desorption rate will be given by [link] .
Since we know the relationship between heat rate β and temperature on the crystal surface T, [link] and [link] .
Multiplying by –dθ gives [link] , since [link] and [link] . A plot of the form of –dθ/dT versus T is shown in [link] .
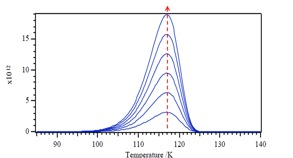
We notice that the T m (peak maximum) in [link] keeps constant with increasing θ, which means the value of T m does not depend on the initial coverage θ in the first-order desorption. If we want to use different desorption activation energy E a and see what happens in the corresponding desorption temperature T. We are able to see the T m values will increase with increasing E a .
At the peak of the mass signal, the increase in the desorption rate is matched by the decrease in surface concentration per unit area so that the change in dθ/dT with T is zero: [link] - [link] . Since [link] , then [link] and [link] .
Notification Switch
Would you like to follow the 'Physical methods in chemistry and nano science' conversation and receive update notifications?

|
|

|
|

|
|

|
|

|
|

|
|

|
|
|
|
|

|
|
|
|