

| << Chapter < Page | Chapter >> Page > |
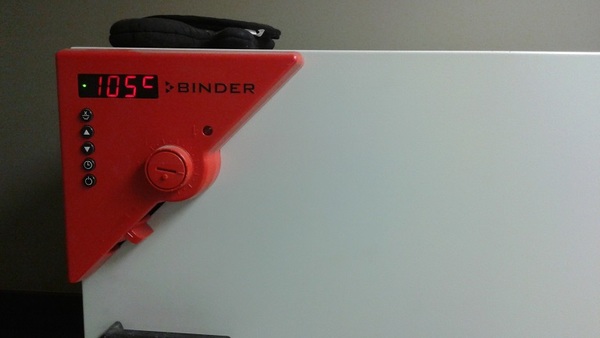
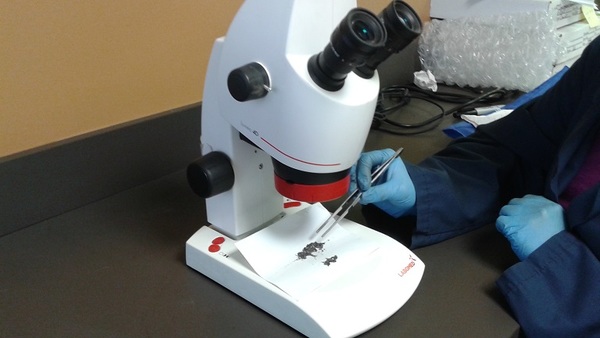
Picking the sample is arguably the most important step in determining the lithology ( [link] ). During this step you will create a sample uniformity to eliminate random minerals, macro contaminates such as wood, and dropstones that dropped into your sediment depth when the sediment was drilled. You will also be able to get a general judgment as to the lithology after picking, though further analysis is needed if chemical composition is desired. Remove sample from drying oven. Take a piece of weighing paper and weigh out 5-10 g of sample. Use a light microscope to determine whether most of the sample is either silt, clay, silty-clay, or sand.
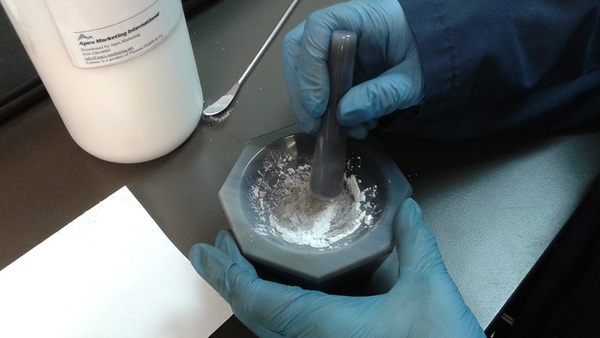
To prepare your sample for X-ray fluorescence (XRF) analysis you will need to prepare a sample pellet. To pellet your sample you will need a mortar and pestle, pellet binder such as Cerox, a scapula to remove binder, a micro scale, a pellet press with housing, and a pellet tin cup. Measure out and pour 2-4 g of sample into your mortar. Measure out and add 50% of your sample weight of pellet binder. For example, if your sample weight was 2 g, add 1 g of binder. Grind the sample into a fine, uniform powder, ensuring that all of the binder is thoroughly mixed with the sample ( [link] ).
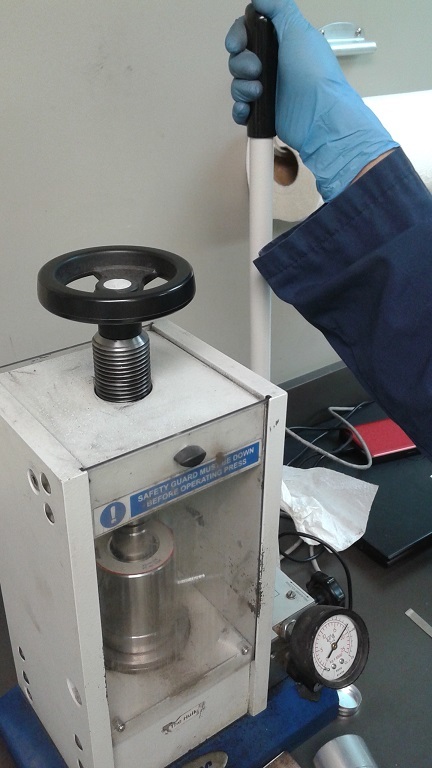
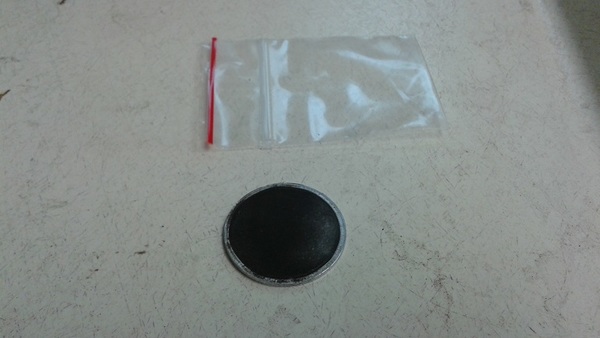
Drop a sample of tin foil into the press housing. Pour sample into the tin foil, and then gently tap the housing against a hard surface two to three times to ensure sample settles into the tin. Place the top press disk into the channel. Place the press housing into the press, oriented directly under the pressing arm. Crank the lever on the press until the pressure gauge reads 15 tons ( [link] ). Wait for one minute, then twist the pressure release valve and remove the press housing from the press. Reverse the press and apply the removal cap to the bottom of the press. Place the housing into the press bottom side up and manually apply pressure by turning the crank on top of the press until the sample pops out of the housing. Retrieve the pelleted sample ( [link] ). The pelleted sample is now ready for X-ray fluorescence analysis (XRF).
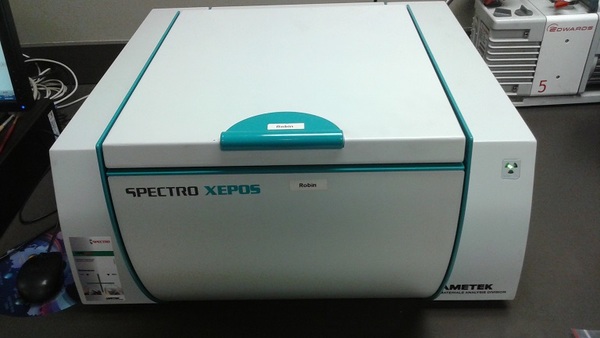
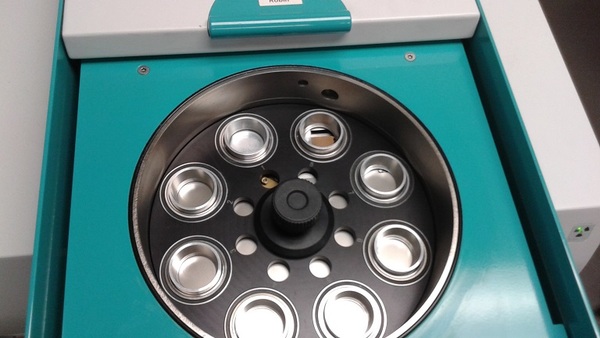
Place the sample pellet into the XRF ( [link] and [link] ) and close the XRF hood. The XRF obtain the spectrum from the associated computer.
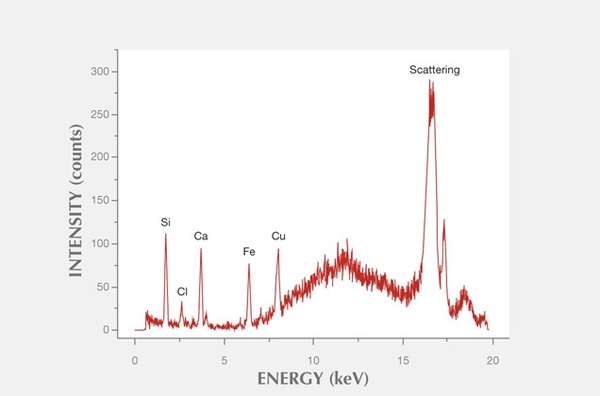
The XRF spectrum is a plot of energy and intensity. The software equipped with the XRF will be pre-programmed to recognize the characteristic energies associated with the X-ray emissions of the elements. The XRF functions by shooting a beam of high energy photons that are absorbed by the atoms of the sample. The inner shell electrons of sample atoms are ejected. This leaves the atom in an excited state, with a vacancy in the inner shell. Outer shell electrons then fall into the vacancy, emitting photons with energy equal to the energy difference between these two energy levels. Each element has a unique set of energy levels, therefore each element emits a pattern of X-rays characteristic of that element. The intensity of these characteristic X-rays increases with the concentration of the corresponding element leading to higher counts and higher peaks on the spectrum ( [link] ).
Notification Switch
Would you like to follow the 'Physical methods in chemistry and nano science' conversation and receive update notifications?

|
|

|
|

|
|

|
|

|
|

|
|
|
|
|

|
|

|
|

|