<< Chapter < Page Chapter >> Page >

Problem-solving strategy: spherical mirrors

Step 1. First make sure that image formation by a spherical mirror is involved.

Step 2. Determine whether ray tracing, the mirror equation, or both are required. A sketch is very useful even if ray tracing is not specifically required by the problem. Write symbols and known values on the sketch.

Step 3. Identify exactly what needs to be determined in the problem (identify the unknowns).

Step 4. Make a list of what is given or can be inferred from the problem as stated (identify the knowns).

Step 5. If ray tracing is required, use the ray-tracing rules listed near the beginning of this section.

Step 6. Most quantitative problems require using the mirror equation. Use the examples as guides for using the mirror equation.

Step 7. Check to see whether the answer makes sense. Do the signs of object distance, image distance, and focal length correspond with what is expected from ray tracing? Is the sign of the magnification correct? Are the object and image distances reasonable?

Departure from the small-angle approximation

The small-angle approximation is a cornerstone of the above discussion of image formation by a spherical mirror. When this approximation is violated, then the image created by a spherical mirror becomes distorted. Such distortion is called aberration    . Here we briefly discuss two specific types of aberrations: spherical aberration and coma.

Spherical aberration

Consider a broad beam of parallel rays impinging on a spherical mirror, as shown in [link] .

Figure a shows the cross section of a concave mirror with several rays parallel to the optical axis incident on it. The reflected rays converge at different points on the optical axis. The rays reflected from points further away from the axis converge closer to the mirror. Figure b shows the cross section of a concave mirror with several rays incident on it. These rays are parallel to each other but angled to the axis. A line labeled focal plane is perpendicular to the optical axis and a slight distance in front of the mirror. Reflected rays hit this line at different points. The front view of the focal plane is shown as a circle, with the label blurred focus.
(a) With spherical aberration, the rays that are farther from the optical axis and the rays that are closer to the optical axis are focused at different points. Notice that the aberration gets worse for rays farther from the optical axis. (b) For comatic aberration, parallel rays that are not parallel to the optical axis are focused at different heights and at different focal lengths, so the image contains a “tail” like a comet (which is “coma” in Latin). Note that the colored rays are only to facilitate viewing; the colors do not indicate the color of the light.

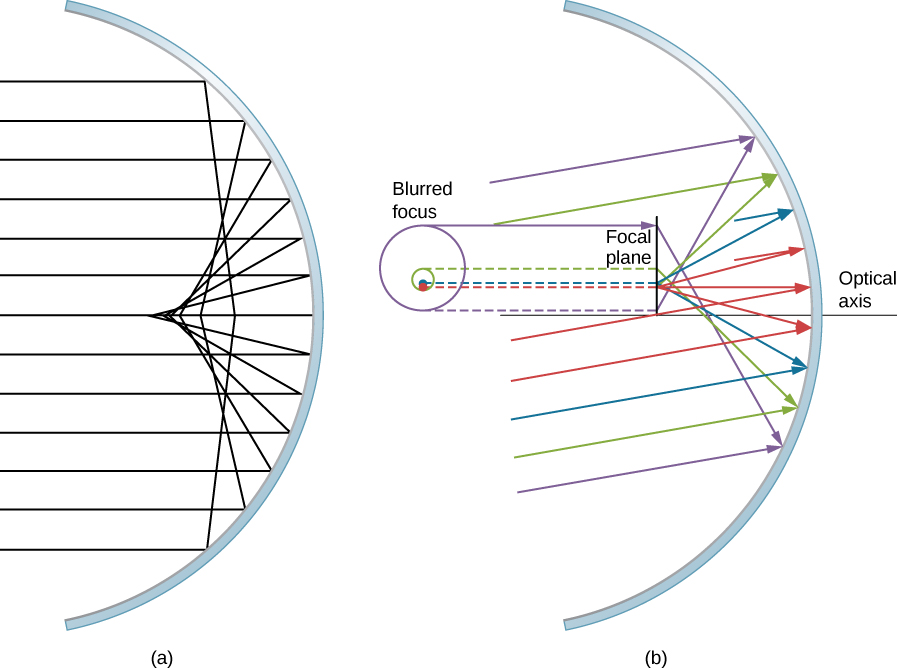
The farther from the optical axis the rays strike, the worse the spherical mirror approximates a parabolic mirror. Thus, these rays are not focused at the same point as rays that are near the optical axis, as shown in the figure. Because of spherical aberration    , the image of an extended object in a spherical mirror will be blurred. Spherical aberrations are characteristic of the mirrors and lenses that we consider in the following section of this chapter (more sophisticated mirrors and lenses are needed to eliminate spherical aberrations).

Coma or comatic aberration

Coma is similar to spherical aberration, but arises when the incoming rays are not parallel to the optical axis, as shown in part (b) of [link] . Recall that the small-angle approximation holds for spherical mirrors that are small compared to their radius. In this case, spherical mirrors are good approximations of parabolic mirrors. Parabolic mirrors focus all rays that are parallel to the optical axis at the focal point. However, parallel rays that are not parallel to the optical axis are focused at different heights and at different focal lengths, as show in part (b) of [link] . Because a spherical mirror is symmetric about the optical axis, the various colored rays in this figure create circles of the corresponding color on the focal plane.

Questions & Answers

how do you get the 2/50
Abba Reply
number of sport play by 50 student construct discrete data
Aminu Reply
width of the frangebany leaves on how to write a introduction
Theresa Reply
Solve the mean of variance
Veronica Reply
Step 1: Find the mean. To find the mean, add up all the scores, then divide them by the number of scores. ... Step 2: Find each score's deviation from the mean. ... Step 3: Square each deviation from the mean. ... Step 4: Find the sum of squares. ... Step 5: Divide the sum of squares by n – 1 or N.
kenneth
what is error
Yakuba Reply
Is mistake done to something
Vutshila
Hy
anas
hy
What is the life teble
anas
hy
Jibrin
statistics is the analyzing of data
Tajudeen Reply
what is statics?
Zelalem Reply
how do you calculate mean
Gloria Reply
diveving the sum if all values
Shaynaynay
let A1,A2 and A3 events be independent,show that (A1)^c, (A2)^c and (A3)^c are independent?
Fisaye Reply
what is statistics
Akhisani Reply
data collected all over the world
Shaynaynay
construct a less than and more than table
Imad Reply
The sample of 16 students is taken. The average age in the sample was 22 years with astandard deviation of 6 years. Construct a 95% confidence interval for the age of the population.
Aschalew Reply
Bhartdarshan' is an internet-based travel agency wherein customer can see videos of the cities they plant to visit. The number of hits daily is a normally distributed random variable with a mean of 10,000 and a standard deviation of 2,400 a. what is the probability of getting more than 12,000 hits? b. what is the probability of getting fewer than 9,000 hits?
Akshay Reply
Bhartdarshan'is an internet-based travel agency wherein customer can see videos of the cities they plan to visit. The number of hits daily is a normally distributed random variable with a mean of 10,000 and a standard deviation of 2,400. a. What is the probability of getting more than 12,000 hits
Akshay
1
Bright
Sorry i want to learn more about this question
Bright
Someone help
Bright
a= 0.20233 b=0.3384
Sufiyan
a
Shaynaynay
How do I interpret level of significance?
Mohd Reply
It depends on your business problem or in Machine Learning you could use ROC- AUC cruve to decide the threshold value
Shivam
how skewness and kurtosis are used in statistics
Owen Reply
yes what is it
Taneeya
Got questions? Join the online conversation and get instant answers!
Jobilize.com Reply

Get Jobilize Job Search Mobile App in your pocket Now!

Get it on Google Play Download on the App Store Now


Source:  OpenStax, University physics volume 3. OpenStax CNX. Nov 04, 2016 Download for free at http://cnx.org/content/col12067/1.4
Google Play and the Google Play logo are trademarks of Google Inc.

Notification Switch

Would you like to follow the 'University physics volume 3' conversation and receive update notifications?

Ask