<< Chapter < Page Chapter >> Page >

These two maxima actually correspond to values of ϕ slightly less than 3 π rad and 5 π rad. Since the total length of the arc of the phasor diagram is always N Δ E 0 , the radius of the arc decreases as ϕ increases. As a result, E 1 and E 2 turn out to be slightly larger for arcs that have not quite curled through 3 π rad and 5 π rad, respectively. The exact values of ϕ for the maxima are investigated in [link] . In solving that problem, you will find that they are less than, but very close to, ϕ = 3 π , 5 π , 7 π , rad .

To calculate the intensity at an arbitrary point P on the screen, we return to the phasor diagram of [link] . Since the arc subtends an angle ϕ at the center of the circle,

N Δ E 0 = r ϕ

and

sin ( ϕ 2 ) = E 2 r .

where E is the amplitude of the resultant field. Solving the second equation for E and then substituting r from the first equation, we find

E = 2 r sin ϕ 2 = 2 N Δ E o ϕ sin ϕ 2 .

Now defining

β = ϕ 2 = π D sin θ λ

we obtain

E = N Δ E 0 sin β β

This equation relates the amplitude of the resultant field at any point in the diffraction pattern to the amplitude N Δ E 0 at the central maximum. The intensity is proportional to the square of the amplitude, so

I = I 0 ( sin β β ) 2

where I 0 = ( N Δ E 0 ) 2 / 2 μ 0 c is the intensity at the center of the pattern.

For the central maximum, ϕ = 0 , β is also zero and we see from l’Hôpital’s rule that lim β 0 ( sin β / β ) = 1 , so that lim ϕ 0 I = I 0 . For the next maximum, ϕ = 3 π rad, we have β = 3 π / 2 rad and when substituted into [link] , it yields

I 1 = I 0 ( sin 3 π / 2 3 π / 2 ) 2 = 0.045 I 0 ,

in agreement with what we found earlier in this section using the diameters and circumferences of phasor diagrams. Substituting ϕ = 5 π rad into [link] yields a similar result for I 2 .

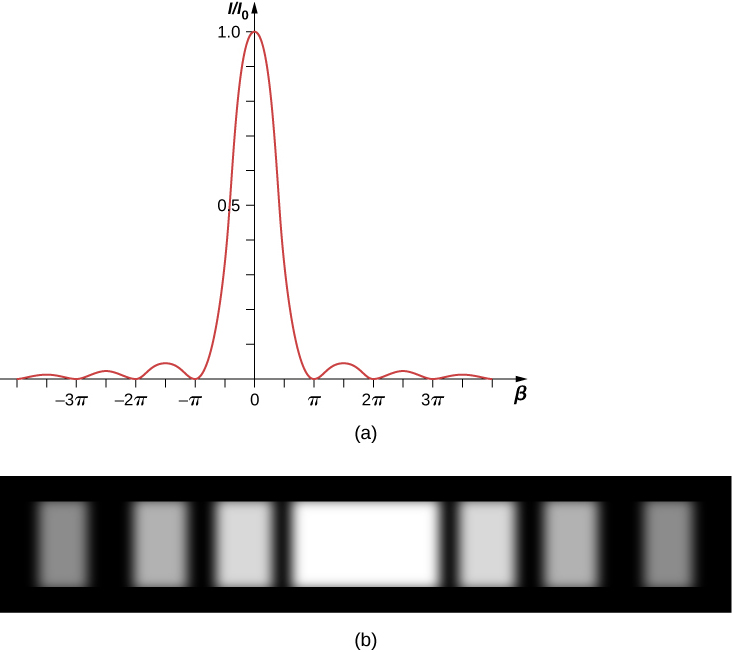
A plot of [link] is shown in [link] and directly below it is a photograph of an actual diffraction pattern. Notice that the central peak is much brighter than the others, and that the zeros of the pattern are located at those points where sin β = 0 , which occurs when β = m π rad. This corresponds to

π D sin θ λ = m π ,

or

D sin θ = m λ ,

which is [link] .

Figure a shows a graph of I by I0 versus beta. There is a crest at the center of the graph at beta equal to 0. The y-value of this is 1. The graph has ripples on both sides of this which grow smaller as you go outwards. The graph has zeroes at minus 3 pi, minus 2 pi, minus pi, pi, 2 pi, 3 pi. Figure b shows a strip with alternating light and dark regions. The central portion is brightest.
(a) The calculated intensity distribution of a single-slit diffraction pattern. (b) The actual diffraction pattern.

Intensity in single-slit diffraction

Light of wavelength 550 nm passes through a slit of width 2.00 μ m and produces a diffraction pattern similar to that shown in [link] . (a) Find the locations of the first two minima in terms of the angle from the central maximum and (b) determine the intensity relative to the central maximum at a point halfway between these two minima.

Strategy

The minima are given by [link] , D sin θ = m λ . The first two minima are for m = 1 and m = 2 . [link] and [link] can be used to determine the intensity once the angle has been worked out.

Solution

  1. Solving [link] for θ gives us θ m = sin −1 ( m λ / D ) , so that
    θ 1 = sin −1 ( ( + 1 ) ( 550 × 10 −9 m ) 2.00 × 10 −6 m ) = + 16.0 °

    and
    θ 2 = sin −1 ( ( + 2 ) ( 550 × 10 −9 m ) 2.00 × 10 −6 m ) = + 33.4 ° .
  2. The halfway point between θ 1 and θ 2 is
    θ = ( θ 1 + θ 2 ) / 2 = ( 16.0 ° + 33.4 ° ) / 2 = 24.7 ° .

[link] gives

β = π D sin θ λ = π ( 2.00 × 10 −6 m ) sin ( 24.7 ° ) ( 550 × 10 −9 m ) = 1.52 π or 4.77 rad .

From [link] , we can calculate

I I o = ( sin β β ) 2 = ( sin ( 4.77 ) 4.77 ) 2 = ( −0.9985 4.77 ) 2 = 0.044 .

Significance

This position, halfway between two minima, is very close to the location of the maximum, expected near β = 3 π / 2 , or 1.5 π .

Got questions? Get instant answers now!

Check Your Understanding For the experiment in [link] , at what angle from the center is the third maximum and what is its intensity relative to the central maximum?

74.3 ° , 0.0083 I 0

Got questions? Get instant answers now!

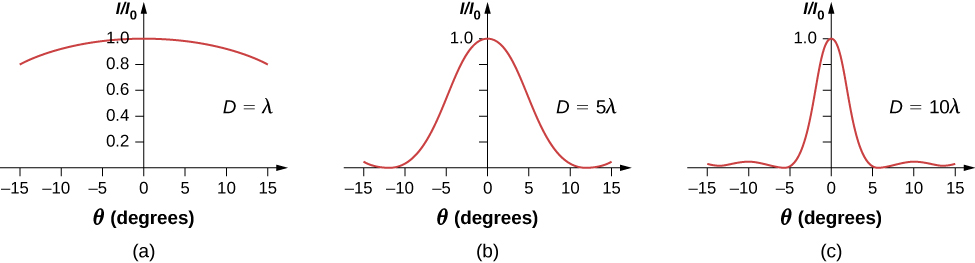
If the slit width D is varied, the intensity distribution changes, as illustrated in [link] . The central peak is distributed over the region from sin θ = λ / D to sin θ = + λ / D . For small θ , this corresponds to an angular width Δ θ 2 λ / D . Hence, an increase in the slit width results in a decrease in the width of the central peak    . For a slit with D λ , the central peak is very sharp, whereas if D λ , it becomes quite broad.

Figures a through c show graphs of I by I0 versus theta in degrees. Each has a wave crest with y value 1 at x=0. Figure a, labeled D equal to lambda has a broad arc. Figure b, labeled D equal to 5 lambda has a narrower crest. It has zeroes roughly between 10 and 15 and between minus 10 and minus 15. Figure c, labeled D equal to 10 lambda has a narrow crest. It has zeroes at plus and minus 5, roughly between 10 and 15 and between minus 10 and minus 15.
Single-slit diffraction patterns for various slit widths. As the slit width D increases from D = λ to 5 λ and then to 10λ , the width of the central peak decreases as the angles for the first minima decrease as predicted by [link] .

A diffraction experiment in optics can require a lot of preparation but this simulation by Andrew Duffy offers not only a quick set up but also the ability to change the slit width instantly. Run the simulation and select “Single slit.” You can adjust the slit width and see the effect on the diffraction pattern on a screen and as a graph.

Summary

  • The intensity pattern for diffraction due to a single slit can be calculated using phasors as
    I = I 0 ( sin β β ) 2 ,

    where β = ϕ 2 = π D sin θ λ , D is the slit width, λ is the wavelength, and θ is the angle from the central peak.

Conceptual questions

In [link] , the parameter β looks like an angle but is not an angle that you can measure with a protractor in the physical world. Explain what β represents.

The parameter β = ϕ / 2 is the arc angle shown in the phasor diagram in [link] . The phase difference between the first and last Huygens wavelet across the single slit is 2 β and is related to the curvature of the arc that forms the resultant phasor that determines the light intensity.

Got questions? Get instant answers now!

Problems

A single slit of width 3.0 μ m is illuminated by a sodium yellow light of wavelength 589 nm. Find the intensity at a 15 ° angle to the axis in terms of the intensity of the central maximum.

Got questions? Get instant answers now!

A single slit of width 0.1 mm is illuminated by a mercury light of wavelength 576 nm. Find the intensity at a 10 ° angle to the axis in terms of the intensity of the central maximum.

I / I 0 = 2.2 × 10 −5

Got questions? Get instant answers now!

The width of the central peak in a single-slit diffraction pattern is 5.0 mm. The wavelength of the light is 600 nm, and the screen is 2.0 m from the slit. (a) What is the width of the slit? (b) Determine the ratio of the intensity at 4.5 mm from the center of the pattern to the intensity at the center.

Got questions? Get instant answers now!

Consider the single-slit diffraction pattern for λ = 600 nm , D = 0.025 mm , and x = 2.0 m . Find the intensity in terms of I o at θ = 0.5 ° , 1.0 ° , 1.5 ° , 3.0 ° , and 10.0 ° .

0.63 I 0 , 0.11 I 0 , 0.0067 I 0 , 0.0062 I 0 , 0.00088 I 0

Got questions? Get instant answers now!

Questions & Answers

how does Neisseria cause meningitis
Nyibol Reply
what is microbiologist
Muhammad Reply
what is errata
Muhammad
is the branch of biology that deals with the study of microorganisms.
Ntefuni Reply
What is microbiology
Mercy Reply
studies of microbes
Louisiaste
when we takee the specimen which lumbar,spin,
Ziyad Reply
How bacteria create energy to survive?
Muhamad Reply
Bacteria doesn't produce energy they are dependent upon their substrate in case of lack of nutrients they are able to make spores which helps them to sustain in harsh environments
_Adnan
But not all bacteria make spores, l mean Eukaryotic cells have Mitochondria which acts as powerhouse for them, since bacteria don't have it, what is the substitution for it?
Muhamad
they make spores
Louisiaste
what is sporadic nd endemic, epidemic
Aminu Reply
the significance of food webs for disease transmission
Abreham
food webs brings about an infection as an individual depends on number of diseased foods or carriers dully.
Mark
explain assimilatory nitrate reduction
Esinniobiwa Reply
Assimilatory nitrate reduction is a process that occurs in some microorganisms, such as bacteria and archaea, in which nitrate (NO3-) is reduced to nitrite (NO2-), and then further reduced to ammonia (NH3).
Elkana
This process is called assimilatory nitrate reduction because the nitrogen that is produced is incorporated in the cells of microorganisms where it can be used in the synthesis of amino acids and other nitrogen products
Elkana
Examples of thermophilic organisms
Shu Reply
Give Examples of thermophilic organisms
Shu
advantages of normal Flora to the host
Micheal Reply
Prevent foreign microbes to the host
Abubakar
they provide healthier benefits to their hosts
ayesha
They are friends to host only when Host immune system is strong and become enemies when the host immune system is weakened . very bad relationship!
Mark
what is cell
faisal Reply
cell is the smallest unit of life
Fauziya
cell is the smallest unit of life
Akanni
ok
Innocent
cell is the structural and functional unit of life
Hasan
is the fundamental units of Life
Musa
what are emergency diseases
Micheal Reply
There are nothing like emergency disease but there are some common medical emergency which can occur simultaneously like Bleeding,heart attack,Breathing difficulties,severe pain heart stock.Hope you will get my point .Have a nice day ❣️
_Adnan
define infection ,prevention and control
Innocent
I think infection prevention and control is the avoidance of all things we do that gives out break of infections and promotion of health practices that promote life
Lubega
Heyy Lubega hussein where are u from?
_Adnan
en français
Adama
which site have a normal flora
ESTHER Reply
Many sites of the body have it Skin Nasal cavity Oral cavity Gastro intestinal tract
Safaa
skin
Asiina
skin,Oral,Nasal,GIt
Sadik
How can Commensal can Bacteria change into pathogen?
Sadik
How can Commensal Bacteria change into pathogen?
Sadik
all
Tesfaye
by fussion
Asiina
what are the advantages of normal Flora to the host
Micheal
what are the ways of control and prevention of nosocomial infection in the hospital
Micheal
what is inflammation
Shelly Reply
part of a tissue or an organ being wounded or bruised.
Wilfred
what term is used to name and classify microorganisms?
Micheal Reply
Binomial nomenclature
adeolu
Got questions? Join the online conversation and get instant answers!
Jobilize.com Reply
Practice Key Terms 1

Get Jobilize Job Search Mobile App in your pocket Now!

Get it on Google Play Download on the App Store Now


Source:  OpenStax, University physics volume 3. OpenStax CNX. Nov 04, 2016 Download for free at http://cnx.org/content/col12067/1.4
Google Play and the Google Play logo are trademarks of Google Inc.

Notification Switch

Would you like to follow the 'University physics volume 3' conversation and receive update notifications?

Ask