<< Chapter < Page Chapter >> Page >

Equations of motion

  1. A cricketer hits a cricket ball straight up into the air. The cricket ball has an initial velocity of 20 m · s - 1 .
    1. What height does the ball reach before it stops to fall back to the ground.
    2. How long has the ball been in the air for?
  2. Zingi throws a tennis ball straight up into the air. It reaches a height of 80 cm.
    1. Determine the initial velocity of the tennis ball.
    2. How long does the ball take to reach its maximum height?
  3. A tourist takes a trip in a hot air balloon. The hot air balloon is ascending (moving up) at a velocity of 4 m · s - 1 . He accidentally drops his camera over the side of the balloon's basket, at a height of 20 m. Calculate the velocity with which the camera hits the ground.

Graphs of vertical projectile motion

Vertical projectile motion is the same as motion at constant acceleration. In Grade 10 you learned about the graphs for motion at constant acceleration. The graphs for vertical projectile motion are therefore identical to the graphs for motion under constant acceleration.

When we draw the graphs for vertical projectile motion, we consider two main situations: an object moving upwards and an object moving downwards.

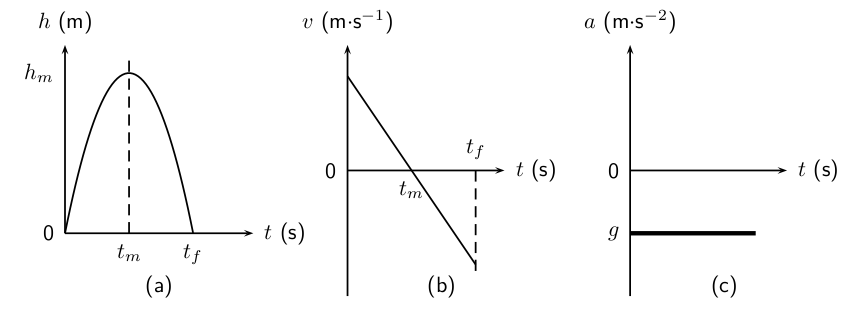
If we take the upwards direction as positive then for an object moving upwards we get the graphs shown in [link] .

Graphs for an object thrown upwards with an initial velocity v i . The object takes t m  s to reach its maximum height of h m  m after which it falls back to the ground. (a) position vs. time graph (b) velocity vs. time graph (c) acceleration vs. time graph.

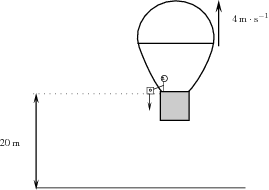
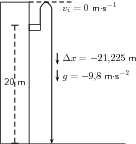
Stanley is standing on the a balcony 20 m above the ground. Stanley tosses up a rubber ball with an initial velocity of 4,9 m · s - 1 . The ball travels upwards and then falls to the ground. Draw graphs of position vs. time, velocity vs. time and acceleration vs. time. Choose upwards as the positive direction.

  1. We are required to draw graphs of

    1. Δ x vs. t
    2. v vs. t
    3. a vs. t
  2. There are two parts to the motion of the ball:

    1. ball travelling upwards from the building
    2. ball falling to the ground

    We examine each of these parts separately. To be able to draw the graphs, we need to determine the time taken and displacement for each of the motions.

  3. For the first part of the motion we have:
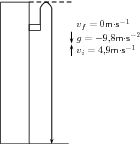
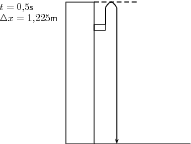
    • v i = + 4 , 9 m · s - 1
    • v f = 0 m · s - 1
    • g = - 9 , 8 m · s - 2

    Therefore we can use v f 2 = v i 2 + 2 g Δ x to solve for the height and v f = v i + g t to solve for the time.

    v f 2 = v i 2 + 2 g Δ x ( 0 ) 2 = ( 4 , 9 ) 2 + 2 × ( - 9 , 8 ) × Δ x 19 , 6 Δ x = ( 4 , 9 ) 2 Δ x = 1 , 225 m
    v f = v i + g t 0 = 4 , 9 + ( - 9 , 8 ) × t 9 , 8 t = 4 , 9 t = 0 , 5 s

  4. For the second part of the motion we have:

    • v i = 0 m · s - 1
    • Δ x = - ( 20 + 1 , 225 ) m
    • g = - 9 , 8 m · s - 2
    Therefore we can use Δ x = v i t + 1 2 g t 2 to solve for the time.
    Δ x = v i t + 1 2 g t 2 - ( 20 + 1 , 225 ) = ( 0 ) × t + 1 2 × ( - 9 , 8 ) × t 2 - 21 , 225 = 0 - 4 , 9 t 2 t 2 = 4 , 33163 . . . t = 2 , 08125 . . . s

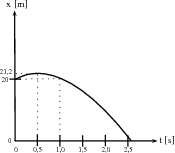
  5. The ball starts from a position of 20 m (at t = 0 s) from the ground and moves upwards until it reaches (20 + 1,225) m (at t = 0,5 s). It then falls back to 20 m (at t = 0,5 + 0,5 = 1,0 s) and then falls to the ground, Δ x = 0 m at (t = 0,5 + 2,08 = 2,58 s).

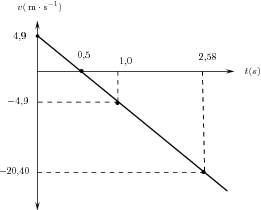
  6. The ball starts off with a velocity of +4,9 m · s - 1 at t = 0 s, it then reaches a velocity of 0 m · s - 1 at t = 0,5 s. It stops and falls back to the Earth. At t = 1,0s (i.e. after a further 0,5s) it has a velocity of -4,9 m · s - 1 . This is the same as the initial upwards velocity but it is downwards. It carries on at constant acceleration until t = 2,58 s. In other words, the velocity graph will be a straight line. The final velocity of the ball can be calculated as follows:

    v f = v i + g t = 0 + ( - 9 , 8 ) ( 2 , 08 . . . ) = - 20 , 396 . . . m · s - 1

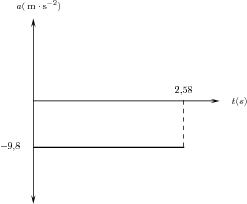
  7. We chose upwards to be positive. The acceleration of the ball is downward. g = - 9 . 8 m · s - 2 . Because the acceleration is constant throughout the motion, the graph looks like this:

Got questions? Get instant answers now!

The graph below (not drawn to scale) shows the motion of tennis ball that was thrown vertically upwards from an open window some distance from the ground. It takes the ball 0,2 s to reach its highest point before falling back to the ground. Study the graph given and calculate

  1. how high the window is above the ground.
  2. the time it takes the ball to reach the maximum height.
  3. the initial velocity of the ball.
  4. the maximum height that the ball reaches.
  5. the final velocity of the ball when it reaches the ground.

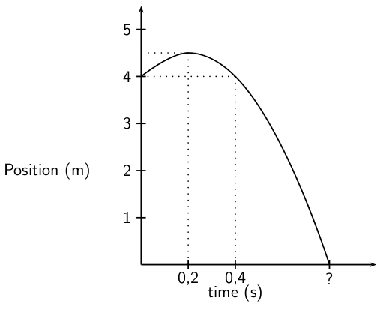
  1. The initial position of the ball will tell us how high the window is. From the y-axis on the graph we can see that the ball is 4 m from the ground.

    The window is therefore 4 m above the ground.

  2. The maximum height is where the position-time graph show the maximum position - the top of the curve. This is when t = 0,2 s.

    It takes the ball 0,2s to reach the maximum height.

  3. To find the initial velocity we only look at the first part of the motion of the ball. That is from when the ball is released until it reaches its maximum height. We have the following for this: In this case, let's choose upwards as positive.

    t = 0 , 2 s g = - 9 , 8 m · s - 2 v f = 0 m · s - 1 ( because the ball stops )

    To calculate the initial velocity of the ball ( v i ), we use:

    v f = v i + g t 0 = v i + ( - 9 , 8 ) ( 0 , 2 ) v i = 1 , 96 m · s - 1

    The initial velocity of the ball is 1,96 m · s - 1 upwards.

  4. To find the maximum height we look at the initial motion of the ball. We have the following:

    t = 0 , 2 s g = - 9 , 8 m · s - 2 v f = 0 m · s - 1 ( because the ball stops ) v i = + 1 , 96 m · s - 1 ( calculated above )

    To calculate the displacement from the window to the maximum height ( Δ x ) we use:

    Δ x = v i t + 1 2 g t 2 Δ x = ( 1 , 96 ) ( 0 , 2 ) + 1 2 ( - 9 , 8 ) ( 0 , 2 ) 2 Δ x = 0 , 196 m

    The maximum height of the ball is (4 + 0,196) = 4,196 m above the ground.

  5. To find the final velocity of the ball we look at the second part of the motion. For this we have:

    Δ x = - 4 , 196 m ( because upwards is positive ) g = - 9 , 8 m · s - 2 v i = 0 m · s - 1

    We can use ( v f ) 2 = ( v i ) 2 + 2 g Δ x to calculate the final velocity of the ball.

    ( v f ) 2 = ( v i ) 2 + 2 g Δ x ( v f ) 2 = ( 0 ) 2 + 2 ( - 9 , 8 ) ( - 4 , 196 ) ( v f ) 2 = 82 , 2416 v f = 9 , 0687 . . . m · s - 1

    The final velocity of the ball is 9,07 m · s - 1 downwards .

Got questions? Get instant answers now!

A cricket ball is hit by a cricketer and the following graph of velocity vs. time was drawn:

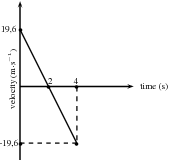
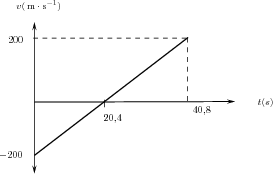
A cricketer hits a cricket ball from the ground and the following graph of velocity vs. time was drawn. Upwards was taken as positive. Study the graph and follow the instructions below:

  1. Describe the motion of the ball according to the graph.
  2. Draw a sketch graph of the corresponding displacement-time graph. Label the axes.
  3. Draw a sketch graph of the corresponding acceleration-time graph. Label the axes.
  1. We need to study the velocity-time graph to answer this question. We will break the motion of the ball up into two time zones: t = 0 s to t = 2 s and t = 2 s to t = 4 s.

    From t = 0 s to t = 2 s the following happens:

    The ball starts to move at an initial velocity of 19,6 m · s - 1 and decreases its velocity to 0 m · s - 1 at t = 2 s. At t = 2 s the velocity of the ball is 0 m · s - 1 and therefore it stops.

    From t = 2 s to t = 4 s the following happens:

    The ball moves from a velocity of 0 m · s - 1 to 19,6 m · s - 1 in the opposite direction to the original motion.

    If we assume that the ball is hit straight up in the air (and we take upwards as positive), it reaches its maximum height at t = 2 s, stops, turns around and falls back to the Earth to reach the ground at t = 4 s.

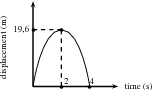
  2. To draw this graph, we need to determine the displacements at t = 2 s and t = 4 s.

    At t = 2 s:

    The displacement is equal to the area under the graph:

    Area under graph = Area of triangle

    Area = 1 2 bh

    Area = 1 2 × 2 × 19,6

    Displacement = 19,6 m

    At t = 4 s:

    The displacement is equal to the area under the whole graph (top and bottom). Remember that an area under the time line must be substracted:

    Area under graph = Area of triangle 1 + Area of triangle 2

    Area = 1 2 bh + 1 2 bh

    Area = ( 1 2 × 2 × 19,6) + ( 1 2 × 2 × (-19,6))

    Area = 19,6 - 19,6

    Displacement = 0 m

    The displacement-time graph for motion at constant acceleration is a curve. The graph will look like this:

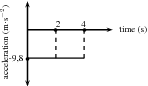
  3. To draw the acceleration vs. time graph, we need to know what the acceleration is. The velocity-time graph is a straight line which means that the acceleration is constant. The gradient of the line will give the acceleration.

    The line has a negative slope (goes down towards the left) which means that the acceleration has a negative value.

    Calculate the gradient of the line:

    gradient = Δ v t

    gradient = 0 - 19 , 6 2 - 0

    gradient = - 19 , 6 2

    gradient = -9,8

    acceleration = 9,8 m · s - 2 downwards

Got questions? Get instant answers now!

Graphs of vertical projectile motion

  1. Amanda throws a tennisball from a height of 1 , 5 m straight up into the air and then lets it fall to the ground. Draw graphs of Δ x vs t ; v vs t and a vs t for the motion of the ball. The initial velocity of the tennisball is 2 m · s - 1 . Choose upwards as positive.
  2. A bullet is shot straight upwards from a gun. The following graph is drawn. Downwards was chosen as positive
    1. Describe the motion of the bullet.
    2. Draw a displacement - time graph.
    3. Draw an acceleration - time graph.

Questions & Answers

what is biology
Hajah Reply
the study of living organisms and their interactions with one another and their environments
AI-Robot
what is biology
Victoria Reply
HOW CAN MAN ORGAN FUNCTION
Alfred Reply
the diagram of the digestive system
Assiatu Reply
allimentary cannel
Ogenrwot
How does twins formed
William Reply
They formed in two ways first when one sperm and one egg are splited by mitosis or two sperm and two eggs join together
Oluwatobi
what is genetics
Josephine Reply
Genetics is the study of heredity
Misack
how does twins formed?
Misack
What is manual
Hassan Reply
discuss biological phenomenon and provide pieces of evidence to show that it was responsible for the formation of eukaryotic organelles
Joseph Reply
what is biology
Yousuf Reply
the study of living organisms and their interactions with one another and their environment.
Wine
discuss the biological phenomenon and provide pieces of evidence to show that it was responsible for the formation of eukaryotic organelles in an essay form
Joseph Reply
what is the blood cells
Shaker Reply
list any five characteristics of the blood cells
Shaker
lack electricity and its more savely than electronic microscope because its naturally by using of light
Abdullahi Reply
advantage of electronic microscope is easily and clearly while disadvantage is dangerous because its electronic. advantage of light microscope is savely and naturally by sun while disadvantage is not easily,means its not sharp and not clear
Abdullahi
cell theory state that every organisms composed of one or more cell,cell is the basic unit of life
Abdullahi
is like gone fail us
DENG
cells is the basic structure and functions of all living things
Ramadan
What is classification
ISCONT Reply
is organisms that are similar into groups called tara
Yamosa
in what situation (s) would be the use of a scanning electron microscope be ideal and why?
Kenna Reply
A scanning electron microscope (SEM) is ideal for situations requiring high-resolution imaging of surfaces. It is commonly used in materials science, biology, and geology to examine the topography and composition of samples at a nanoscale level. SEM is particularly useful for studying fine details,
Hilary
cell is the building block of life.
Condoleezza Reply
Got questions? Join the online conversation and get instant answers!
Jobilize.com Reply

Get Jobilize Job Search Mobile App in your pocket Now!

Get it on Google Play Download on the App Store Now


Source:  OpenStax, Siyavula textbooks: grade 12 physical science. OpenStax CNX. Aug 03, 2011 Download for free at http://cnx.org/content/col11244/1.2
Google Play and the Google Play logo are trademarks of Google Inc.

Notification Switch

Would you like to follow the 'Siyavula textbooks: grade 12 physical science' conversation and receive update notifications?

Ask