

| << Chapter < Page | Chapter >> Page > |
You have learnt previously about the structure of an atom. The electrons surrounding the atomic nucleus are arranged in a series of levels of increasing energy. Each element has its own distinct set of energy levels. This arrangement of energy levels serves as the atom's unique fingerprint.
In the early 1900s, scientists found that a liquid or solid heated to high temperatures would give off a broad range of colours of light. However, a gas heated to similar temperatures would emit light only at certain specific colours (wavelengths). The reason for this observation was not understood at the time.
Scientists studied this effect using a discharge tube.
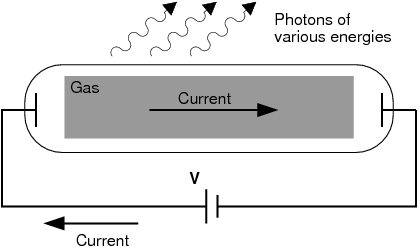
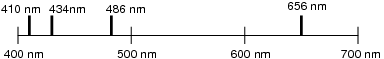
A discharge tube ( [link] ) is a glass gas-filled tube with a metal plate at both ends. If a large enough voltage difference is applied between the two metal plates, the gas atoms inside the tube will absorb enough energy to make some of their electrons come off i.e. the gas atoms are ionised. These electrons start moving through the gas and create a current, which raises some electrons in other atoms to higher energy levels. Then as the electrons in the atoms fall back down, they emit electromagnetic radiation (light). The amount of light emitted at different wavelengths, called the emission spectrum , is shown for a discharge tube filled with hydrogen gas in [link] below. Only certain wavelengths (i.e. colours) of light are seen as shown by the thick black lines in the picture.
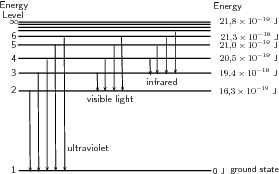
Eventually, scientists realized that these lines come from photons of a specific energy, emitted by electrons making transitions between specific energy levels of the atom. [link] shows an example of this happening. When an electron in an atom falls from a higher energy level to a lower energy level, it emits a photon to carry off the extra energy. This photon's energy is equal to the energy difference between the two energy levels. As we previously discussed, the frequency of a photon is related to its energy through the equation . Since a specific photon frequency (or wavelength) gives us a specific colour, we can see how each coloured line is associated with a specific transition.
Notification Switch
Would you like to follow the 'Siyavula textbooks: grade 12 physical science' conversation and receive update notifications?

|
|

|
|

|
|

|
|

|
|

|
|

|
|

|
|

|
|

|