<< Chapter < Page Chapter >> Page >
An infrared image of stars near the center of the Milky way. Eight orbits are shown with several data points on each. The orbits differ in eccentricity, orientation, and size, but all overlap near the center of the image.
Paths of stars orbiting about a mass at the center of our Milky Way galaxy. From their motion, it is estimated that a black hole of about 4 million solar masses resides at the center. (credit: UCLA Galactic Center Group – W.M. Keck Observatory Laser Team)

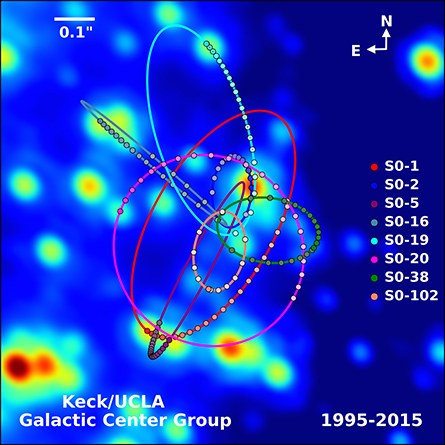
The physics of stellar creation and evolution is well established. The ultimate source of energy that makes stars shine is the self-gravitational energy that triggers fusion. The general behavior is that the more massive a star, the brighter it shines and the shorter it lives. The logical inference is that a mass that is 4 million times the mass of our Sun, confined to a very small region, and that cannot be seen, has no viable interpretation other than a black hole. Extragalactic observations strongly suggest that black holes are common at the center of galaxies.

Visit the UCLA Galactic Center Group main page for information on X-ray binaries and gravitational lensing. Visit this page to view a three-dimensional visualization of the stars orbiting near the center of our galaxy, where the animation is near the bottom of the page.

Dark matter

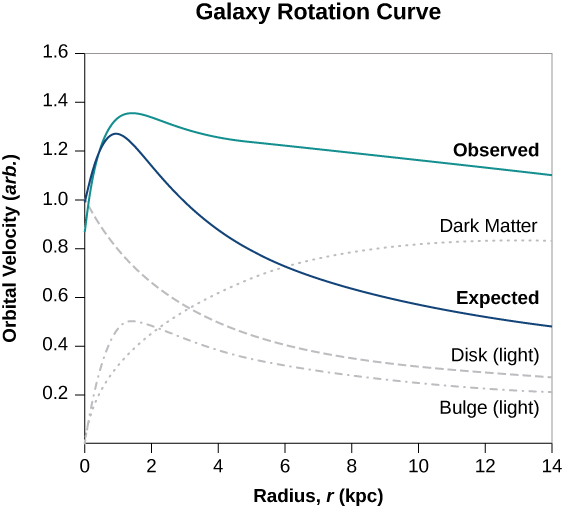
Stars orbiting near the very heart of our galaxy provide strong evidence for a black hole there, but the orbits of stars far from the center suggest another intriguing phenomenon that is observed indirectly as well. Recall from Gravitation Near Earth’s Surface that we can consider the mass for spherical objects to be located at a point at the center for calculating their gravitational effects on other masses. Similarly, we can treat the total mass that lies within the orbit of any star in our galaxy as being located at the center of the Milky Way disc. We can estimate that mass from counting the visible stars and include in our estimate the mass of the black hole at the center as well.

But when we do that, we find the orbital speed of the stars is far too fast to be caused by that amount of matter. [link] shows the orbital velocities of stars as a function of their distance from the center of the Milky Way. The blue line represents the velocities we would expect from our estimates of the mass, whereas the green curve is what we get from direct measurements. Apparently, there is a lot of matter we don’t see, estimated to be about five times as much as what we do see, so it has been dubbed dark matter . Furthermore, the velocity profile does not follow what we expect from the observed distribution of visible stars. Not only is the estimate of the total mass inconsistent with the data, but the expected distribution is inconsistent as well. And this phenomenon is not restricted to our galaxy, but seems to be a feature of all galaxies. In fact, the issue was first noted in the 1930s when galaxies within clusters were measured to be orbiting about the center of mass of those clusters faster than they should based upon visible mass estimates.

Graph of Galaxy rotation curve plotting orbital velocity in arbitrary units as a function of radius, r, in kiloparsecs. The horizontal axis scale is 0 to 14 kiloparsecs, in increments of 2. The vertical axis scale is 0 to 1.6 in increments of 0.2. A green curve is labeled Observed. The curve starts at r=0, v=0.9, rises to almost v=1.4 at r a little less than 2, then decreases to about v = 1.3 at about r = 4, then more slowly to about v = 1.2 at r = 14. A blue curve is labeled Expected. The curve starts at r=0, v=1.0 ad rises to a maximum value that is smaller than the green curve’s and at a smaller value of r. The curve then decreases smoothly with steadily decreasing slope to v approximately 0.5 at r = 14.Three additional gray curves are also shown. A dotted curve labeled dark matter starts at r=0, v=0 and rises smoothly with steadily decreasing slope to v approximately 0.9 at r = 14. A dot-dashed curve labeled Bulge (light) also starts at r=0, v=0 and rises to a maximum value of about v = 0.5 at an r between 1 and 2, then decreases smoothly with steadily decreasing slope to v approximately 0.2 at r = 14. A dashed curve labeled Disk (light) starts at r=0, v=1 and decreases smoothly with steadily decreasing slope to v approximately 0.3 at r = 14.
The blue curve shows the expected orbital velocity of stars in the Milky Way based upon the visible stars we can see. The green curve shows that the actually velocities are higher, suggesting additional matter that cannot be seen. (credit: modification of work by Matthew Newby)

Questions & Answers

how do you get the 2/50
Abba Reply
number of sport play by 50 student construct discrete data
Aminu Reply
width of the frangebany leaves on how to write a introduction
Theresa Reply
Solve the mean of variance
Veronica Reply
Step 1: Find the mean. To find the mean, add up all the scores, then divide them by the number of scores. ... Step 2: Find each score's deviation from the mean. ... Step 3: Square each deviation from the mean. ... Step 4: Find the sum of squares. ... Step 5: Divide the sum of squares by n – 1 or N.
kenneth
what is error
Yakuba Reply
Is mistake done to something
Vutshila
Hy
anas
hy
What is the life teble
anas
hy
Jibrin
statistics is the analyzing of data
Tajudeen Reply
what is statics?
Zelalem Reply
how do you calculate mean
Gloria Reply
diveving the sum if all values
Shaynaynay
let A1,A2 and A3 events be independent,show that (A1)^c, (A2)^c and (A3)^c are independent?
Fisaye Reply
what is statistics
Akhisani Reply
data collected all over the world
Shaynaynay
construct a less than and more than table
Imad Reply
The sample of 16 students is taken. The average age in the sample was 22 years with astandard deviation of 6 years. Construct a 95% confidence interval for the age of the population.
Aschalew Reply
Bhartdarshan' is an internet-based travel agency wherein customer can see videos of the cities they plant to visit. The number of hits daily is a normally distributed random variable with a mean of 10,000 and a standard deviation of 2,400 a. what is the probability of getting more than 12,000 hits? b. what is the probability of getting fewer than 9,000 hits?
Akshay Reply
Bhartdarshan'is an internet-based travel agency wherein customer can see videos of the cities they plan to visit. The number of hits daily is a normally distributed random variable with a mean of 10,000 and a standard deviation of 2,400. a. What is the probability of getting more than 12,000 hits
Akshay
1
Bright
Sorry i want to learn more about this question
Bright
Someone help
Bright
a= 0.20233 b=0.3384
Sufiyan
a
Shaynaynay
How do I interpret level of significance?
Mohd Reply
It depends on your business problem or in Machine Learning you could use ROC- AUC cruve to decide the threshold value
Shivam
how skewness and kurtosis are used in statistics
Owen Reply
yes what is it
Taneeya
Got questions? Join the online conversation and get instant answers!
Jobilize.com Reply
Practice Key Terms 9

Get Jobilize Job Search Mobile App in your pocket Now!

Get it on Google Play Download on the App Store Now


Source:  OpenStax, University physics volume 1. OpenStax CNX. Sep 19, 2016 Download for free at http://cnx.org/content/col12031/1.5
Google Play and the Google Play logo are trademarks of Google Inc.

Notification Switch

Would you like to follow the 'University physics volume 1' conversation and receive update notifications?

Ask