<< Chapter < Page Chapter >> Page >
By the end of this section, you will be able to:
  • Explain the difference between sound and hearing
  • Describe sound as a wave
  • List the equations used to model sound waves
  • Describe compression and rarefactions as they relate to sound

The physical phenomenon of sound    is a disturbance of matter that is transmitted from its source outward. Hearing is the perception of sound, just as seeing is the perception of visible light. On the atomic scale, sound is a disturbance of atoms that is far more ordered than their thermal motions. In many instances, sound is a periodic wave, and the atoms undergo simple harmonic motion. Thus, sound waves can induce oscillations and resonance effects ( [link] ).

Picture shows a photograph of a wine glass shattering into many little pieces.
This glass has been shattered by a high-intensity sound wave of the same frequency as the resonant frequency of the glass. (credit: “||read||”/Flickr)

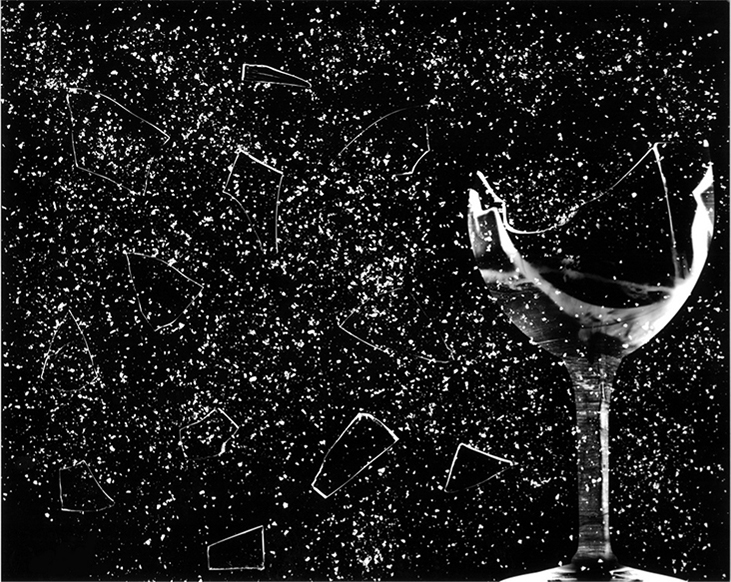
This video shows waves on the surface of a wine glass, being driven by sound waves from a speaker. As the frequency of the sound wave approaches the resonant frequency of the wine glass, the amplitude and frequency of the waves on the wine glass increase. When the resonant frequency is reached, the glass shatters.

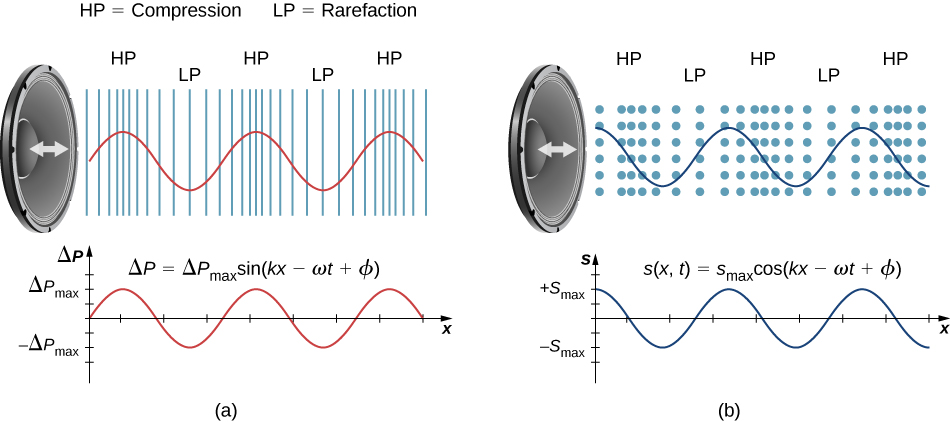
A speaker produces a sound wave by oscillating a cone, causing vibrations of air molecules. In [link] , a speaker vibrates at a constant frequency and amplitude, producing vibrations in the surrounding air molecules. As the speaker oscillates back and forth, it transfers energy to the air, mostly as thermal energy. But a small part of the speaker’s energy goes into compressing and expanding the surrounding air, creating slightly higher and lower local pressures. These compressions (high-pressure regions) and rarefactions (low-pressure regions) move out as longitudinal pressure waves having the same frequency as the speaker—they are the disturbance that is a sound wave. (Sound waves in air and most fluids are longitudinal, because fluids have almost no shear strength. In solids, sound waves can be both transverse and longitudinal.)

[link] (a) shows the compressions and rarefactions, and also shows a graph of gauge pressure versus distance from a speaker. As the speaker moves in the positive x -direction, it pushes air molecules, displacing them from their equilibrium positions. As the speaker moves in the negative x -direction, the air molecules move back toward their equilibrium positions due to a restoring force. The air molecules oscillate in simple harmonic motion about their equilibrium positions, as shown in part (b). Note that sound waves in air are longitudinal, and in the figure, the wave propagates in the positive x -direction and the molecules oscillate parallel to the direction in which the wave propagates.

Figure A is a graph that shows the gauge pressure of the air versus the distance from the speaker. The gauge pressure is modeled with a sine function, where the crests of the function line up with the compressions and the troughs line up with the rarefactions. Figure B is the displacement of the air molecules versus the position. The displacement is modeled with a cosine function, where the zeroes are for the molecules in their equilibrium position and are centered at the compressions and rarefactions.
(a) A vibrating cone of a speaker, moving in the positive x -direction, compresses the air in front of it and expands the air behind it. As the speaker oscillates, it creates another compression and rarefaction as those on the right move away from the speaker. After many vibrations, a series of compressions and rarefactions moves out from the speaker as a sound wave. The red graph shows the gauge pressure of the air versus the distance from the speaker. Pressures vary only slightly from atmospheric pressure for ordinary sounds. Note that gauge pressure is modeled with a sine function, where the crests of the function line up with the compressions and the troughs line up with the rarefactions. (b) Sound waves can also be modeled using the displacement of the air molecules. The blue graph shows the displacement of the air molecules versus the position from the speaker and is modeled with a cosine function. Notice that the displacement is zero for the molecules in their equilibrium position and are centered at the compressions and rarefactions. Compressions are formed when molecules on either side of the equilibrium molecules are displaced toward the equilibrium position. Rarefactions are formed when the molecules are displaced away from the equilibrium position.

Questions & Answers

differentiate between demand and supply giving examples
Lambiv Reply
differentiated between demand and supply using examples
Lambiv
what is labour ?
Lambiv
how will I do?
Venny Reply
how is the graph works?I don't fully understand
Rezat Reply
information
Eliyee
devaluation
Eliyee
t
WARKISA
hi guys good evening to all
Lambiv
multiple choice question
Aster Reply
appreciation
Eliyee
explain perfect market
Lindiwe Reply
In economics, a perfect market refers to a theoretical construct where all participants have perfect information, goods are homogenous, there are no barriers to entry or exit, and prices are determined solely by supply and demand. It's an idealized model used for analysis,
Ezea
What is ceteris paribus?
Shukri Reply
other things being equal
AI-Robot
When MP₁ becomes negative, TP start to decline. Extuples Suppose that the short-run production function of certain cut-flower firm is given by: Q=4KL-0.6K2 - 0.112 • Where is quantity of cut flower produced, I is labour input and K is fixed capital input (K-5). Determine the average product of lab
Kelo
Extuples Suppose that the short-run production function of certain cut-flower firm is given by: Q=4KL-0.6K2 - 0.112 • Where is quantity of cut flower produced, I is labour input and K is fixed capital input (K-5). Determine the average product of labour (APL) and marginal product of labour (MPL)
Kelo
yes,thank you
Shukri
Can I ask you other question?
Shukri
what is monopoly mean?
Habtamu Reply
What is different between quantity demand and demand?
Shukri Reply
Quantity demanded refers to the specific amount of a good or service that consumers are willing and able to purchase at a give price and within a specific time period. Demand, on the other hand, is a broader concept that encompasses the entire relationship between price and quantity demanded
Ezea
ok
Shukri
how do you save a country economic situation when it's falling apart
Lilia Reply
what is the difference between economic growth and development
Fiker Reply
Economic growth as an increase in the production and consumption of goods and services within an economy.but Economic development as a broader concept that encompasses not only economic growth but also social & human well being.
Shukri
production function means
Jabir
What do you think is more important to focus on when considering inequality ?
Abdisa Reply
any question about economics?
Awais Reply
sir...I just want to ask one question... Define the term contract curve? if you are free please help me to find this answer 🙏
Asui
it is a curve that we get after connecting the pareto optimal combinations of two consumers after their mutually beneficial trade offs
Awais
thank you so much 👍 sir
Asui
In economics, the contract curve refers to the set of points in an Edgeworth box diagram where both parties involved in a trade cannot be made better off without making one of them worse off. It represents the Pareto efficient allocations of goods between two individuals or entities, where neither p
Cornelius
In economics, the contract curve refers to the set of points in an Edgeworth box diagram where both parties involved in a trade cannot be made better off without making one of them worse off. It represents the Pareto efficient allocations of goods between two individuals or entities,
Cornelius
Suppose a consumer consuming two commodities X and Y has The following utility function u=X0.4 Y0.6. If the price of the X and Y are 2 and 3 respectively and income Constraint is birr 50. A,Calculate quantities of x and y which maximize utility. B,Calculate value of Lagrange multiplier. C,Calculate quantities of X and Y consumed with a given price. D,alculate optimum level of output .
Feyisa Reply
Answer
Feyisa
c
Jabir
the market for lemon has 10 potential consumers, each having an individual demand curve p=101-10Qi, where p is price in dollar's per cup and Qi is the number of cups demanded per week by the i th consumer.Find the market demand curve using algebra. Draw an individual demand curve and the market dema
Gsbwnw Reply
suppose the production function is given by ( L, K)=L¼K¾.assuming capital is fixed find APL and MPL. consider the following short run production function:Q=6L²-0.4L³ a) find the value of L that maximizes output b)find the value of L that maximizes marginal product
Abdureman
types of unemployment
Yomi Reply
What is the difference between perfect competition and monopolistic competition?
Mohammed
Got questions? Join the online conversation and get instant answers!
Jobilize.com Reply
Practice Key Terms 2

Get Jobilize Job Search Mobile App in your pocket Now!

Get it on Google Play Download on the App Store Now


Source:  OpenStax, University physics volume 1. OpenStax CNX. Sep 19, 2016 Download for free at http://cnx.org/content/col12031/1.5
Google Play and the Google Play logo are trademarks of Google Inc.

Notification Switch

Would you like to follow the 'University physics volume 1' conversation and receive update notifications?

Ask