<< Chapter < Page Chapter >> Page >
By the end of this section, you will be able to:
  • Model a wave, moving with a constant wave velocity, with a mathematical expression
  • Calculate the velocity and acceleration of the medium
  • Show how the velocity of the medium differs from the wave velocity (propagation velocity)

In the previous section, we described periodic waves by their characteristics of wavelength, period, amplitude, and wave speed of the wave. Waves can also be described by the motion of the particles of the medium through which the waves move. The position of particles of the medium can be mathematically modeled as wave function     s , which can be used to find the position, velocity, and acceleration of the particles of the medium of the wave at any time.

Pulses

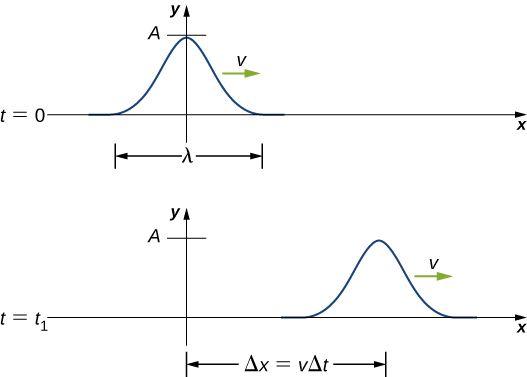
A pulse    can be described as wave consisting of a single disturbance that moves through the medium with a constant amplitude. The pulse moves as a pattern that maintains its shape as it propagates with a constant wave speed. Because the wave speed is constant, the distance the pulse moves in a time Δ t is equal to Δ x = v Δ t ( [link] ).

Figure a shows a pulse wave, a wave with a single crest at time t=0. The distance between the start and end of the wave is labeled lambda. The crest is at y=0. The vertical distance of the crest from the origin is labeled A. The wave propagates towards the right with velocity v. Figure b shows the same wave at time t=t subscript 1. The pulse has moved towards the right. The horizontal distance of the crest from the y axis is labeled delta x equal to v delta t.
The pulse at time t = 0 is centered on x = 0 with amplitude A . The pulse moves as a pattern with a constant shape, with a constant maximum value A . The velocity is constant and the pulse moves a distance Δ x = v Δ t in a time Δ t . The distance traveled is measured with any convenient point on the pulse. In this figure, the crest is used.

Modeling a one-dimensional sinusoidal wave using a wave function

Consider a string kept at a constant tension F T where one end is fixed and the free end is oscillated between y = + A and y = A by a mechanical device at a constant frequency. [link] shows snapshots of the wave at an interval of an eighth of a period, beginning after one period ( t = T ) .

Figure shows different stages of a transverse wave propagating towards the right, taken at intervals of 1 by 8 T. Dots mark points on the wave. These move up and down from – A to +A. A dot that is at the equilibrium position at time t=T, moves to +A at time t=T plus 2 by 8 T. It then moves back to the equilibrium position at time t= T plus 4 by 8 T. It moves to –A at time t=T plus 6 by 8 T and back to the equilibrium position at time t=2T. Similarly, all dots move to their original positions at time t=2T.
Snapshots of a transverse wave moving through a string under tension, beginning at time t = T and taken at intervals of 1 8 T . Colored dots are used to highlight points on the string. Points that are a wavelength apart in the x -direction are highlighted with the same color dots.

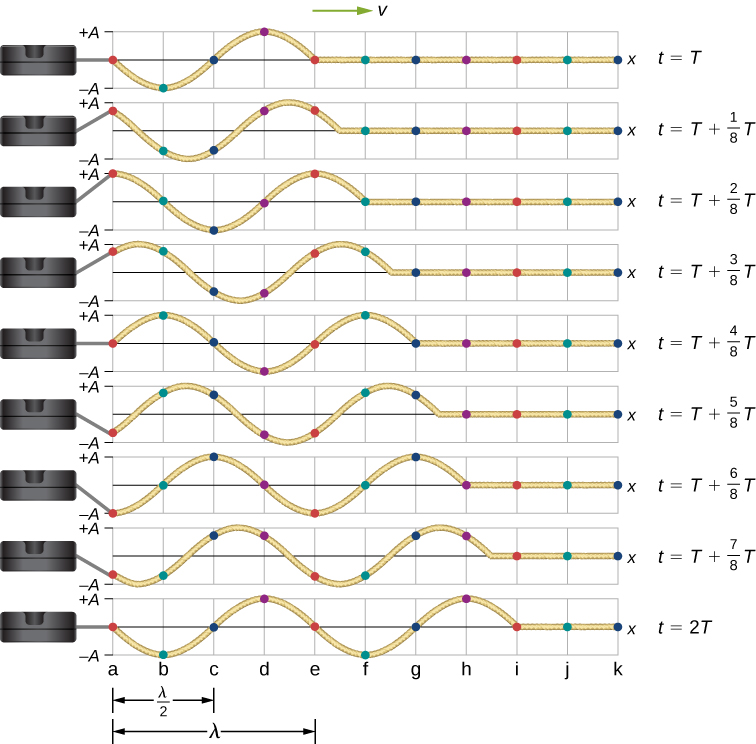
Notice that each select point on the string (marked by colored dots) oscillates up and down in simple harmonic motion, between y = + A and y = A , with a period T . The wave on the string is sinusoidal and is translating in the positive x -direction as time progresses.

At this point, it is useful to recall from your study of algebra that if f ( x ) is some function, then f ( x d ) is the same function translated in the positive x -direction by a distance d . The function f ( x + d ) is the same function translated in the negative x -direction by a distance d . We want to define a wave function that will give the y -position of each segment of the string for every position x along the string for every time t .

Looking at the first snapshot in [link] , the y -position of the string between x = 0 and x = λ can be modeled as a sine function. This wave propagates down the string one wavelength in one period, as seen in the last snapshot. The wave therefore moves with a constant wave speed of v = λ / T .

Recall that a sine function is a function of the angle θ , oscillating between + 1 and −1 , and repeating every 2 π radians ( [link] ). However, the y -position of the medium, or the wave function, oscillates between + A and A , and repeats every wavelength λ .

Questions & Answers

differentiate between demand and supply giving examples
Lambiv Reply
differentiated between demand and supply using examples
Lambiv
what is labour ?
Lambiv
how will I do?
Venny Reply
how is the graph works?I don't fully understand
Rezat Reply
information
Eliyee
devaluation
Eliyee
t
WARKISA
hi guys good evening to all
Lambiv
multiple choice question
Aster Reply
appreciation
Eliyee
explain perfect market
Lindiwe Reply
In economics, a perfect market refers to a theoretical construct where all participants have perfect information, goods are homogenous, there are no barriers to entry or exit, and prices are determined solely by supply and demand. It's an idealized model used for analysis,
Ezea
What is ceteris paribus?
Shukri Reply
other things being equal
AI-Robot
When MP₁ becomes negative, TP start to decline. Extuples Suppose that the short-run production function of certain cut-flower firm is given by: Q=4KL-0.6K2 - 0.112 • Where is quantity of cut flower produced, I is labour input and K is fixed capital input (K-5). Determine the average product of lab
Kelo
Extuples Suppose that the short-run production function of certain cut-flower firm is given by: Q=4KL-0.6K2 - 0.112 • Where is quantity of cut flower produced, I is labour input and K is fixed capital input (K-5). Determine the average product of labour (APL) and marginal product of labour (MPL)
Kelo
yes,thank you
Shukri
Can I ask you other question?
Shukri
what is monopoly mean?
Habtamu Reply
What is different between quantity demand and demand?
Shukri Reply
Quantity demanded refers to the specific amount of a good or service that consumers are willing and able to purchase at a give price and within a specific time period. Demand, on the other hand, is a broader concept that encompasses the entire relationship between price and quantity demanded
Ezea
ok
Shukri
how do you save a country economic situation when it's falling apart
Lilia Reply
what is the difference between economic growth and development
Fiker Reply
Economic growth as an increase in the production and consumption of goods and services within an economy.but Economic development as a broader concept that encompasses not only economic growth but also social & human well being.
Shukri
production function means
Jabir
What do you think is more important to focus on when considering inequality ?
Abdisa Reply
any question about economics?
Awais Reply
sir...I just want to ask one question... Define the term contract curve? if you are free please help me to find this answer 🙏
Asui
it is a curve that we get after connecting the pareto optimal combinations of two consumers after their mutually beneficial trade offs
Awais
thank you so much 👍 sir
Asui
In economics, the contract curve refers to the set of points in an Edgeworth box diagram where both parties involved in a trade cannot be made better off without making one of them worse off. It represents the Pareto efficient allocations of goods between two individuals or entities, where neither p
Cornelius
In economics, the contract curve refers to the set of points in an Edgeworth box diagram where both parties involved in a trade cannot be made better off without making one of them worse off. It represents the Pareto efficient allocations of goods between two individuals or entities,
Cornelius
Suppose a consumer consuming two commodities X and Y has The following utility function u=X0.4 Y0.6. If the price of the X and Y are 2 and 3 respectively and income Constraint is birr 50. A,Calculate quantities of x and y which maximize utility. B,Calculate value of Lagrange multiplier. C,Calculate quantities of X and Y consumed with a given price. D,alculate optimum level of output .
Feyisa Reply
Answer
Feyisa
c
Jabir
the market for lemon has 10 potential consumers, each having an individual demand curve p=101-10Qi, where p is price in dollar's per cup and Qi is the number of cups demanded per week by the i th consumer.Find the market demand curve using algebra. Draw an individual demand curve and the market dema
Gsbwnw Reply
suppose the production function is given by ( L, K)=L¼K¾.assuming capital is fixed find APL and MPL. consider the following short run production function:Q=6L²-0.4L³ a) find the value of L that maximizes output b)find the value of L that maximizes marginal product
Abdureman
types of unemployment
Yomi Reply
What is the difference between perfect competition and monopolistic competition?
Mohammed
Got questions? Join the online conversation and get instant answers!
Jobilize.com Reply
Practice Key Terms 4

Get Jobilize Job Search Mobile App in your pocket Now!

Get it on Google Play Download on the App Store Now


Source:  OpenStax, University physics volume 1. OpenStax CNX. Sep 19, 2016 Download for free at http://cnx.org/content/col12031/1.5
Google Play and the Google Play logo are trademarks of Google Inc.

Notification Switch

Would you like to follow the 'University physics volume 1' conversation and receive update notifications?

Ask