<< Chapter < Page Chapter >> Page >
By the end of this section, you will be able to:
  • Describe the physics of rolling motion without slipping
  • Explain how linear variables are related to angular variables for the case of rolling motion without slipping
  • Find the linear and angular accelerations in rolling motion with and without slipping
  • Calculate the static friction force associated with rolling motion without slipping
  • Use energy conservation to analyze rolling motion

Rolling motion is that common combination of rotational and translational motion that we see everywhere, every day. Think about the different situations of wheels moving on a car along a highway, or wheels on a plane landing on a runway, or wheels on a robotic explorer on another planet. Understanding the forces and torques involved in rolling motion    is a crucial factor in many different types of situations.

For analyzing rolling motion in this chapter, refer to [link] in Fixed-Axis Rotation to find moments of inertia of some common geometrical objects. You may also find it useful in other calculations involving rotation.

Rolling motion without slipping

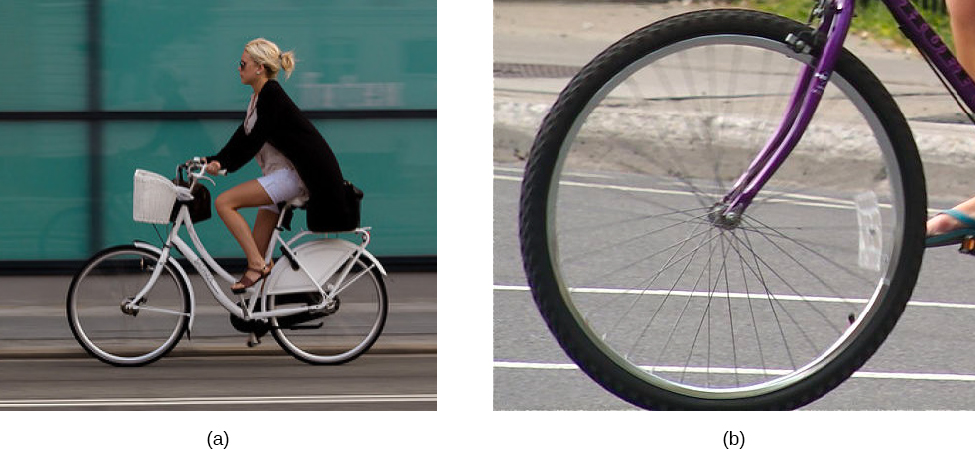
People have observed rolling motion without slipping ever since the invention of the wheel. For example, we can look at the interaction of a car’s tires and the surface of the road. If the driver depresses the accelerator to the floor, such that the tires spin without the car moving forward, there must be kinetic friction between the wheels and the surface of the road. If the driver depresses the accelerator slowly, causing the car to move forward, then the tires roll without slipping. It is surprising to most people that, in fact, the bottom of the wheel is at rest with respect to the ground, indicating there must be static friction between the tires and the road surface. In [link] , the bicycle is in motion with the rider staying upright. The tires have contact with the road surface, and, even though they are rolling, the bottoms of the tires deform slightly, do not slip, and are at rest with respect to the road surface for a measurable amount of time. There must be static friction between the tire and the road surface for this to be so.

Figure a is a photograph of a person riding a bicycle. The camera followed the bike, so the image of the bike and rider is sharp, the background is blurred due to bike’s motion. Figure b is a photograph of a bicycle wheel rolling on the ground, with the camera stationary relative to the ground. The wheel and spokes are blurred at the top but clear at the bottom.
(a) The bicycle moves forward, and its tires do not slip. The bottom of the slightly deformed tire is at rest with respect to the road surface for a measurable amount of time. (b) This image shows that the top of a rolling wheel appears blurred by its motion, but the bottom of the wheel is instantaneously at rest. (credit a: modification of work by Nelson Lourenço; credit b: modification of work by Colin Rose)

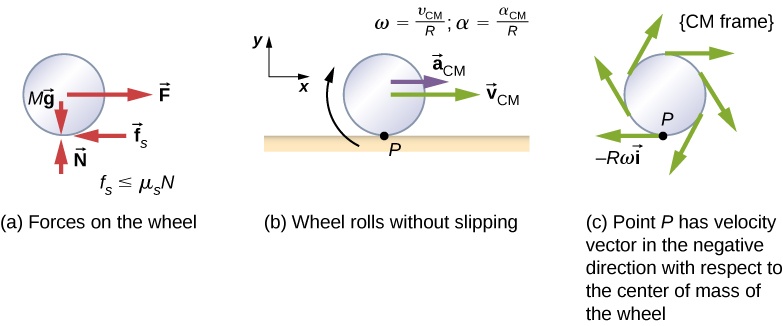
To analyze rolling without slipping, we first derive the linear variables of velocity and acceleration of the center of mass of the wheel in terms of the angular variables that describe the wheel’s motion. The situation is shown in [link] .

Figure a shows a free body diagram of a wheel, including the location where the forces act. Four forces are shown: M g is a downward force acting on the center of the wheel. N is an upward force acting on the bottom of the wheel. F is a force to the right, acting on the center of the wheel, and f sub s is a force to the left acting on the bottom of the wheel. The force f sub s is smaller or equal to mu sub s times N. Figure b is an illustration of a wheel rolling without slipping on a horizontal surface. Point P is the contact point between the bottom of the wheel and the surface. The wheel has a clockwise rotation, an acceleration to the right of a sub C M and a velocity to the right of v sub V M. The relations omega equals v sub C M over R and alpha equals a sub C M over R are given. A coordinate system with positive x to the right and positive y up is shown. Figure c shows wheel in the center of mass frame. Point P has velocity vector in the negative direction with respect to the center of mass of the wheel. That vector is shown on the diagram and labeled as minus R omega i hat. It is tangent to the wheel at the bottom, and pointing to the left. Additional vectors at various locations on the rim of the wheel are shown, all tangent to the wheel and pointing clockwise.
(a) A wheel is pulled across a horizontal surface by a force F . The force of static friction f S , | f S | μ S N is large enough to keep it from slipping. (b) The linear velocity and acceleration vectors of the center of mass and the relevant expressions for ω and α . Point P is at rest relative to the surface. (c) Relative to the center of mass (CM) frame, point P has linear velocity R ω i ^ .

Questions & Answers

What are the factors that affect demand for a commodity
Florence Reply
differentiate between demand and supply giving examples
Lambiv Reply
differentiated between demand and supply using examples
Lambiv
what is labour ?
Lambiv
how will I do?
Venny Reply
how is the graph works?I don't fully understand
Rezat Reply
information
Eliyee
devaluation
Eliyee
t
WARKISA
hi guys good evening to all
Lambiv
multiple choice question
Aster Reply
appreciation
Eliyee
explain perfect market
Lindiwe Reply
In economics, a perfect market refers to a theoretical construct where all participants have perfect information, goods are homogenous, there are no barriers to entry or exit, and prices are determined solely by supply and demand. It's an idealized model used for analysis,
Ezea
What is ceteris paribus?
Shukri Reply
other things being equal
AI-Robot
When MP₁ becomes negative, TP start to decline. Extuples Suppose that the short-run production function of certain cut-flower firm is given by: Q=4KL-0.6K2 - 0.112 • Where is quantity of cut flower produced, I is labour input and K is fixed capital input (K-5). Determine the average product of lab
Kelo
Extuples Suppose that the short-run production function of certain cut-flower firm is given by: Q=4KL-0.6K2 - 0.112 • Where is quantity of cut flower produced, I is labour input and K is fixed capital input (K-5). Determine the average product of labour (APL) and marginal product of labour (MPL)
Kelo
yes,thank you
Shukri
Can I ask you other question?
Shukri
what is monopoly mean?
Habtamu Reply
What is different between quantity demand and demand?
Shukri Reply
Quantity demanded refers to the specific amount of a good or service that consumers are willing and able to purchase at a give price and within a specific time period. Demand, on the other hand, is a broader concept that encompasses the entire relationship between price and quantity demanded
Ezea
ok
Shukri
how do you save a country economic situation when it's falling apart
Lilia Reply
what is the difference between economic growth and development
Fiker Reply
Economic growth as an increase in the production and consumption of goods and services within an economy.but Economic development as a broader concept that encompasses not only economic growth but also social & human well being.
Shukri
production function means
Jabir
What do you think is more important to focus on when considering inequality ?
Abdisa Reply
any question about economics?
Awais Reply
sir...I just want to ask one question... Define the term contract curve? if you are free please help me to find this answer 🙏
Asui
it is a curve that we get after connecting the pareto optimal combinations of two consumers after their mutually beneficial trade offs
Awais
thank you so much 👍 sir
Asui
In economics, the contract curve refers to the set of points in an Edgeworth box diagram where both parties involved in a trade cannot be made better off without making one of them worse off. It represents the Pareto efficient allocations of goods between two individuals or entities, where neither p
Cornelius
In economics, the contract curve refers to the set of points in an Edgeworth box diagram where both parties involved in a trade cannot be made better off without making one of them worse off. It represents the Pareto efficient allocations of goods between two individuals or entities,
Cornelius
Suppose a consumer consuming two commodities X and Y has The following utility function u=X0.4 Y0.6. If the price of the X and Y are 2 and 3 respectively and income Constraint is birr 50. A,Calculate quantities of x and y which maximize utility. B,Calculate value of Lagrange multiplier. C,Calculate quantities of X and Y consumed with a given price. D,alculate optimum level of output .
Feyisa Reply
Answer
Feyisa
c
Jabir
the market for lemon has 10 potential consumers, each having an individual demand curve p=101-10Qi, where p is price in dollar's per cup and Qi is the number of cups demanded per week by the i th consumer.Find the market demand curve using algebra. Draw an individual demand curve and the market dema
Gsbwnw Reply
suppose the production function is given by ( L, K)=L¼K¾.assuming capital is fixed find APL and MPL. consider the following short run production function:Q=6L²-0.4L³ a) find the value of L that maximizes output b)find the value of L that maximizes marginal product
Abdureman
Got questions? Join the online conversation and get instant answers!
Jobilize.com Reply
Practice Key Terms 1

Get Jobilize Job Search Mobile App in your pocket Now!

Get it on Google Play Download on the App Store Now


Source:  OpenStax, University physics volume 1. OpenStax CNX. Sep 19, 2016 Download for free at http://cnx.org/content/col12031/1.5
Google Play and the Google Play logo are trademarks of Google Inc.

Notification Switch

Would you like to follow the 'University physics volume 1' conversation and receive update notifications?

Ask