<< Chapter < Page Chapter >> Page >
Part a of the diagram shows a pressure versus volume graph. The pressure is along the Y axis and the volume is along the X axis. The curve has a rectangular shape. The curve is labeled A B C D. The paths A B and D C represent isobaric processes as shown by lines pointing toward the right, and A D and B C represent isochoric processes, as shown by lines pointing vertically downward. W sub A B C is shown greater than W sub A D C. The area below the curve A B C D, filling the rectangle A B C D, and the area immediately below path D C are also shaded. Part b of the diagram shows a pressure versus volume graph. The pressure is along the Y axis and the volume is along the X axis. The curve has a rectangular shape and is labeled A B C D. The paths A B and C D represent isobaric processes; A B is a line pointing to the right, and C D is a line pointing to the left. The paths B C and D A represent isochoric processes; B C points vertically downward, and D A points vertically upward. The length of the graph along A B is marked as delta V equals five hundred centimeters cubed. The line A B on the graph is shown to have a pressure P sub A B equals one point five multiplied by ten to the power six Newtons per meter square. The line D on the graph is shown to have a pressure P sub C D equals one point two multiplied by ten to the power five Newtons per meter squared. The total work is marked as W sub tot equals W sub out plus W sub in. Part c of the diagram shows a pressure versus volume graph. The pressure is along the Y axis and the volume is along the X axis. The graph is a closed loop in the form of an ellipse with the arrow pointing in clockwise direction. The shaded area inside the ellipse represents the work done.
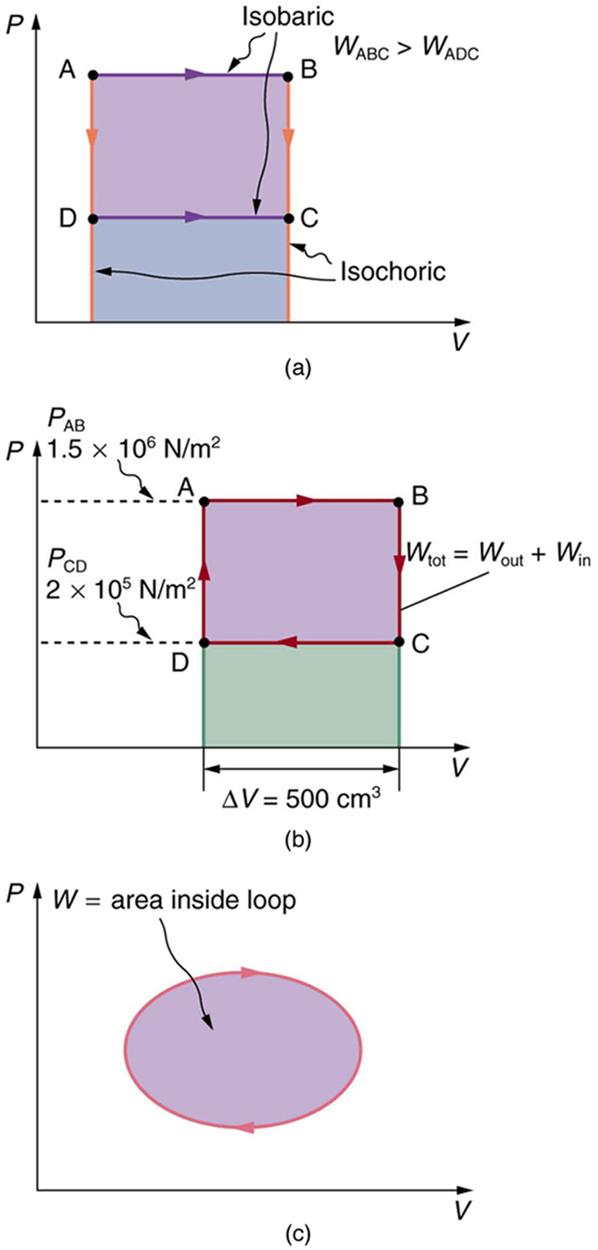
(a) The work done in going from A to C depends on path. The work is greater for the path ABC than for the path ADC, because the former is at higher pressure. In both cases, the work done is the area under the path. This area is greater for path ABC. (b) The total work done in the cyclical process ABCDA is the area inside the loop, since the negative area below CD subtracts out, leaving just the area inside the rectangle. (The values given for the pressures and the change in volume are intended for use in the example below.) (c) The area inside any closed loop is the work done in the cyclical process. If the loop is traversed in a clockwise direction, W size 12{W} {} is positive—it is work done on the outside environment. If the loop is traveled in a counter-clockwise direction, W size 12{W} {} is negative—it is work that is done to the system.

Total work done in a cyclical process equals the area inside the closed loop on a PV Diagram

Calculate the total work done in the cyclical process ABCDA shown in [link] (b) by the following two methods to verify that work equals the area inside the closed loop on the PV size 12{ ital "PV"} {} diagram. (Take the data in the figure to be precise to three significant figures.) (a) Calculate the work done along each segment of the path and add these values to get the total work. (b) Calculate the area inside the rectangle ABCDA.

Strategy

To find the work along any path on a PV size 12{ ital "PV"} {} diagram, you use the fact that work is pressure times change in volume, or W = P Δ V size 12{W=PΔV} {} . So in part (a), this value is calculated for each leg of the path around the closed loop.

Solution for (a)

The work along path AB is

W AB = P AB Δ V AB = ( 1 . 50 × 10 6 N/m 2 ) ( 5 . 00 × 10 –4 m 3 ) = 750 J. alignl { stack { size 12{W rSub { size 8{"AB"} } =P rSub { size 8{"AB"} } DV rSub { size 8{"AB"} } } {} #= \( 1 "." "50"´"10" rSup { size 8{6} } " N/m" rSup { size 8{2} } \) \( 5 "." "00"´"10" rSup { size 8{4} } " m" rSup { size 8{3} } \) ="750"" J" "." {} } } {}

Since the path BC is isochoric, Δ V BC = 0 size 12{DV rSub { size 8{"BC"} } =0} {} , and so W BC = 0 size 12{W rSub { size 8{"BC"} } =0} {} . The work along path CD is negative, since Δ V CD size 12{DV rSub { size 8{"CD"} } } {} is negative (the volume decreases). The work is

W CD = P CD Δ V CD = ( 2 . 00 × 10 5 N/m 2 ) ( –5 . 00 × 10 –4 m 3 ) = 100 J . alignl { stack { size 12{W rSub { size 8{"CD"} } =P rSub { size 8{"CD"} } DV rSub { size 8{"CD"} } } {} #= \( 2 "." "00"´"10" rSup { size 8{5} } " N/m" rSup { size 8{2} } \) \( 5 "." "00"´"10" rSup { size 8{4} } " m" rSup { size 8{3} } \) "=-""100"" J" "." {} } } {}

Again, since the path DA is isochoric, Δ V DA = 0 size 12{DV rSub { size 8{"DA"} } =0} {} , and so W DA = 0 size 12{W rSub { size 8{"DA"} } =0} {} . Now the total work is

W = W AB + W BC + W CD + W DA = 750 J + 0 + ( 100 J ) + 0 = 650 J.

Solution for (b)

The area inside the rectangle is its height times its width, or

area = ( P AB P CD ) Δ V = ( 1.50 × 10 6 N/m 2 ) ( 2 . 00 × 10 5 N/m 2 ) ( 5 . 00 × 10 4 m 3 ) = 650 J. alignl { stack { size 12{"area"= \( P rSub { size 8{"AB"} } -P rSub { size 8{"CD"} } \) DV} {} #= left [ \( 1 "." "50"´"10" rSup { size 8{6} } " N/m" rSup { size 8{2} } \) - \( 2 "." "00"´"10" rSup { size 8{5} } " N/m" rSup { size 8{2} } \) right ]´ \( 5 "." "00"´"10" rSup { size 8{-4} } " m" rSup { size 8{3} } \) {} #="750"" J" "." {} } } {}

Thus,

area = 650 J = W . size 12{"area"="650"" J"=W} {}

Discussion

The result, as anticipated, is that the area inside the closed loop equals the work done. The area is often easier to calculate than is the work done along each path. It is also convenient to visualize the area inside different curves on PV size 12{ ital "PV"} {} diagrams in order to see which processes might produce the most work. Recall that work can be done to the system, or by the system, depending on the sign of W size 12{W} {} . A positive W size 12{W} {} is work that is done by the system on the outside environment; a negative W size 12{W} {} represents work done by the environment on the system.

[link] (a) shows two other important processes on a PV size 12{ ital "PV"} {} diagram. For comparison, both are shown starting from the same point A. The upper curve ending at point B is an isothermal process—that is, one in which temperature is kept constant. If the gas behaves like an ideal gas, as is often the case, and if no phase change occurs, then PV = nRT size 12{ ital "PV"= ital "nRT"} {} . Since T size 12{T} {} is constant, PV size 12{ ital "PV"} {} is a constant for an isothermal process. We ordinarily expect the temperature of a gas to decrease as it expands, and so we correctly suspect that heat transfer must occur from the surroundings to the gas to keep the temperature constant during an isothermal expansion. To show this more rigorously for the special case of a monatomic ideal gas, we note that the average kinetic energy of an atom in such a gas is given by

Questions & Answers

how to study physic and understand
Ewa Reply
what is conservative force with examples
Moses
what is work
Fredrick Reply
the transfer of energy by a force that causes an object to be displaced; the product of the component of the force in the direction of the displacement and the magnitude of the displacement
AI-Robot
why is it from light to gravity
Esther Reply
difference between model and theory
Esther
Is the ship moving at a constant velocity?
Kamogelo Reply
The full note of modern physics
aluet Reply
introduction to applications of nuclear physics
aluet Reply
the explanation is not in full details
Moses Reply
I need more explanation or all about kinematics
Moses
yes
zephaniah
I need more explanation or all about nuclear physics
aluet
Show that the equal masses particles emarge from collision at right angle by making explicit used of fact that momentum is a vector quantity
Muhammad Reply
yh
Isaac
A wave is described by the function D(x,t)=(1.6cm) sin[(1.2cm^-1(x+6.8cm/st] what are:a.Amplitude b. wavelength c. wave number d. frequency e. period f. velocity of speed.
Majok Reply
what is frontier of physics
Somto Reply
A body is projected upward at an angle 45° 18minutes with the horizontal with an initial speed of 40km per second. In hoe many seconds will the body reach the ground then how far from the point of projection will it strike. At what angle will the horizontal will strike
Gufraan Reply
Suppose hydrogen and oxygen are diffusing through air. A small amount of each is released simultaneously. How much time passes before the hydrogen is 1.00 s ahead of the oxygen? Such differences in arrival times are used as an analytical tool in gas chromatography.
Ezekiel Reply
please explain
Samuel
what's the definition of physics
Mobolaji Reply
what is physics
Nangun Reply
the science concerned with describing the interactions of energy, matter, space, and time; it is especially interested in what fundamental mechanisms underlie every phenomenon
AI-Robot
what is isotopes
Nangun Reply
nuclei having the same Z and different N s
AI-Robot
Practice Key Terms 6

Get Jobilize Job Search Mobile App in your pocket Now!

Get it on Google Play Download on the App Store Now


Source:  OpenStax, College physics. OpenStax CNX. Jul 27, 2015 Download for free at http://legacy.cnx.org/content/col11406/1.9
Google Play and the Google Play logo are trademarks of Google Inc.

Notification Switch

Would you like to follow the 'College physics' conversation and receive update notifications?

Ask