We use electric field lines to visualize and analyze electric fields (the lines are a pictorial tool, not a physical entity in themselves). The properties of electric field lines for any charge distribution can be summarized as follows:
Field lines must begin on positive charges and terminate on negative charges, or at infinity in the hypothetical case of isolated charges.
The number of field lines leaving a positive charge or entering a negative charge is proportional to the magnitude of the charge.
The strength of the field is proportional to the closeness of the field lines—more precisely, it is proportional to the number of lines per unit area perpendicular to the lines.
The direction of the electric field is tangent to the field line at any point in space.
Field lines can never cross.
The last property means that the field is unique at any point. The field line represents the direction of the field; so if they crossed, the field would have two directions at that location (an impossibility if the field is unique).
Phet explorations: charges and fields
Move point charges around on the playing field and then view the electric field, voltages, equipotential lines, and more. It's colorful, it's dynamic, it's free.
Drawings of electric field lines are useful visual tools. The properties of electric field lines for any charge distribution are that:
Field lines must begin on positive charges and terminate on negative charges, or at infinity in the hypothetical case of isolated charges.
The number of field lines leaving a positive charge or entering a negative charge is proportional to the magnitude of the charge.
The strength of the field is proportional to the closeness of the field lines—more precisely, it is proportional to the number of lines per unit area perpendicular to the lines.
The direction of the electric field is tangent to the field line at any point in space.
Field lines can never cross.
Conceptual questions
Compare and contrast the Coulomb force field and the electric field. To do this, make a list of five properties for the Coulomb force field analogous to the five properties listed for electric field lines. Compare each item in your list of Coulomb force field properties with those of the electric field—are they the same or different? (For example, electric field lines cannot cross. Is the same true for Coulomb field lines?)
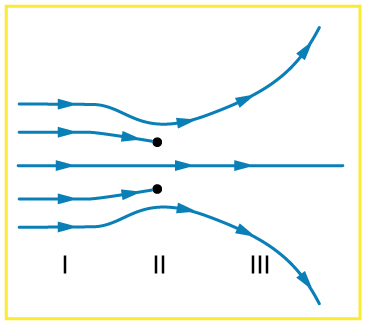
[link] shows an electric field extending over three regions, labeled I, II, and III. Answer the following questions. (a) Are there any isolated charges? If so, in what region and what are their signs? (b) Where is the field strongest? (c) Where is it weakest? (d) Where is the field the most uniform?
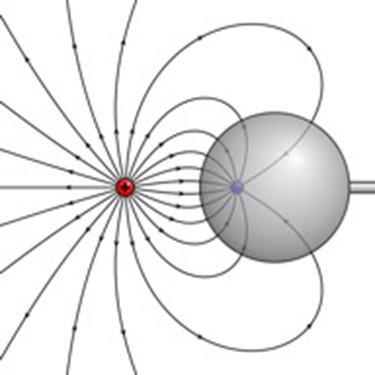
[link] shows the electric field lines near two charges
and
. What is the ratio of their magnitudes? (b) Sketch the electric field lines a long distance from the charges shown in the figure.
Sketch the electric field lines in the vicinity of two opposite charges, where the negative charge is three times greater in magnitude than the positive. (See
[link] for a similar situation).
Step 1: Find the mean. To find the mean, add up all the scores, then divide them by the number of scores. ...
Step 2: Find each score's deviation from the mean. ...
Step 3: Square each deviation from the mean. ...
Step 4: Find the sum of squares. ...
Step 5: Divide the sum of squares by n – 1 or N.
The sample of 16 students is taken. The average age in the sample was 22 years with astandard deviation of 6 years. Construct a 95% confidence interval for the age of the population.
Bhartdarshan' is an internet-based travel agency wherein customer can see videos of the cities they plant to visit. The number of hits daily is a normally distributed random variable with a mean of 10,000 and a standard deviation of 2,400
a. what is the probability of getting more than 12,000 hits?
b. what is the probability of getting fewer than 9,000 hits?
Bhartdarshan'is an internet-based travel agency wherein customer can see videos of the cities they plan to visit. The number of hits daily is a normally distributed random variable with a mean of 10,000 and a standard deviation of 2,400.
a. What is the probability of getting more than 12,000 hits