<< Chapter < Page Chapter >> Page >
I 0 Z = I 0 2 R 2 + ( I 0 X L I 0 X C ) 2 = I 0 R 2 + ( X L X C ) 2 . size 12{I rSub { size 8{0} } Z= sqrt {I rSub { size 8{0} rSup { size 8{2} } } R rSup { size 8{2} } + \( I rSub { size 8{0} } X rSub { size 8{L} } - I rSub { size 8{0} } X rSub { size 8{C} } \) rSup { size 8{2} } } =I rSub { size 8{0} } sqrt {R rSup { size 8{2} } + \( X rSub { size 8{L} } - X rSub { size 8{C} } \) rSup { size 8{2} } } } {}

I 0 size 12{I rSub { size 8{0} } } {} cancels to yield an expression for Z :

Z = R 2 + ( X L X C ) 2 , size 12{Z= sqrt {R rSup { size 8{2} } + \( X rSub { size 8{L} } - X rSub { size 8{C} } \) rSup { size 8{2} } } } {}

which is the impedance of an RLC series AC circuit. For circuits without a resistor, take R = 0 ; for those without an inductor, take X L = 0 size 12{X rSub { size 8{L} } =0} {} ; and for those without a capacitor, take X C = 0 size 12{X rSub { size 8{C} } =0} {} .

The figure shows graphs showing the relationships of the voltages in an RLC circuit to the current. It has five graphs on the left and two graphs on the right. The first graph on the right is for current I versus time t. Current is plotted along Y axis and time is along X axis. The curve is a smooth progressive sine wave. The second graph is on the right is for voltage V R versus time t. Voltage V R is plotted along Y axis and time is along X axis. The curve is a smooth progressive sine wave. The third graph is on the right is for voltage V L versus time t. Voltage V L is plotted along Y axis and time is along X axis. The curve is a smooth progressive cosine wave. The fourth graph is on the right is for voltage V C versus time t. Voltage V C is plotted along Y axis and time t is along X axis. The curve is a smooth progressive cosine wave starting from negative Y axis. The fifth graph shows the voltage V verses time t for the R L C circuit. Voltage V is plotted along Y axis and time t is along X axis. The curve is a smooth progressive sine wave starting from a point near to origin on negative X axis. The first and the fifth graphs are again shown on the right and their amplitudes and phases compared. The current graph is shown to have a lesser amplitude.
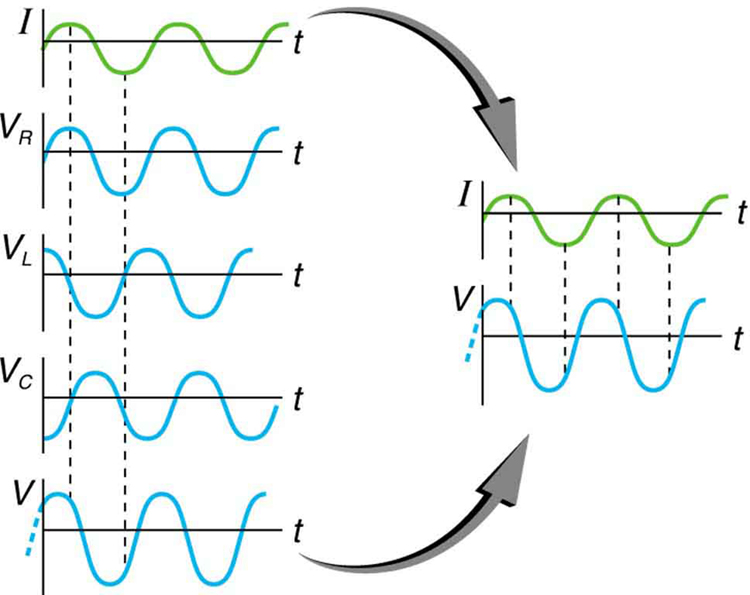
This graph shows the relationships of the voltages in an RLC circuit to the current. The voltages across the circuit elements add to equal the voltage of the source, which is seen to be out of phase with the current.

Calculating impedance and current

An RLC series circuit has a 40.0 Ω resistor, a 3.00 mH inductor, and a 5.00 μF capacitor. (a) Find the circuit’s impedance at 60.0 Hz and 10.0 kHz, noting that these frequencies and the values for L and C are the same as in [link] and [link] . (b) If the voltage source has V rms = 120 V size 12{V rSub { size 8{"rms"} } ="120"`V} {} , what is I rms size 12{I rSub { size 8{"rms"} } } {} at each frequency?

Strategy

For each frequency, we use Z = R 2 + ( X L X C ) 2 size 12{Z= sqrt {R rSup { size 8{2} } + \( X rSub { size 8{L} } - X rSub { size 8{C} } \) rSup { size 8{2} } } } {} to find the impedance and then Ohm’s law to find current. We can take advantage of the results of the previous two examples rather than calculate the reactances again.

Solution for (a)

At 60.0 Hz, the values of the reactances were found in [link] to be X L = 1 . 13 Ω size 12{X rSub { size 8{L} } =1 "." "13" %OMEGA } {} and in [link] to be X C = 531 Ω size 12{X rSub { size 8{C} } ="531 " %OMEGA } {} . Entering these and the given 40.0 Ω for resistance into Z = R 2 + ( X L X C ) 2 size 12{Z= sqrt {R rSup { size 8{2} } + \( X rSub { size 8{L} } - X rSub { size 8{C} } \) rSup { size 8{2} } } } {} yields

Z = R 2 + ( X L X C ) 2 = ( 40 . 0 Ω ) 2 + ( 1 . 13 Ω 531 Ω ) 2 = 531 Ω  at 60 . 0 Hz . alignl { stack { size 12{Z= sqrt {R rSup { size 8{2} } + \( X rSub { size 8{L} } - X rSub { size 8{C} } \) rSup { size 8{2} } } } {} #" "= sqrt { \( "40" "." 0` %OMEGA \) rSup { size 8{2} } + \( 1 "." "13" %OMEGA - "531" %OMEGA \) rSup { size 8{2} } } {} # " "="531" %OMEGA " at 60" "." "0 Hz" {}} } {}

Similarly, at 10.0 kHz, X L = 188 Ω size 12{X rSub { size 8{L} } ="188" %OMEGA } {} and X C = 3 . 18 Ω size 12{X rSub { size 8{C} } =3 "." "18" %OMEGA } {} , so that

Z = ( 40 . 0 Ω ) 2 + ( 188 Ω 3 . 18 Ω ) 2 = 190 Ω  at 10 . 0 kHz. alignl { stack { size 12{Z= sqrt { \( "40" "." 0` %OMEGA \) rSup { size 8{2} } + \( "188" %OMEGA - 3 "." "18" %OMEGA \) rSup { size 8{2} } } } {} #" "="190" %OMEGA " at 10" "." "0 kHz" {} } } {}

Discussion for (a)

In both cases, the result is nearly the same as the largest value, and the impedance is definitely not the sum of the individual values. It is clear that X L size 12{X rSub { size 8{L} } } {} dominates at high frequency and X C size 12{X rSub { size 8{C} } } {} dominates at low frequency.

Solution for (b)

The current I rms size 12{I rSub { size 8{"rms"} } } {} can be found using the AC version of Ohm’s law in Equation I rms = V rms / Z size 12{I rSub { size 8{"rms"} } =V rSub { size 8{"rms"} } /Z} {} :

I rms = V rms Z = 120 V 531 Ω = 0 . 226 A size 12{I rSub { size 8{"rms"} } = { {V rSub { size 8{"rms"} } } over {Z} } = { {"120"" V"} over {"531 " %OMEGA } } =0 "." "226"" A"} {} at 60.0 Hz

Finally, at 10.0 kHz, we find

I rms = V rms Z = 120 V 190 Ω = 0 . 633 A size 12{I rSub { size 8{"rms"} } = { {V rSub { size 8{"rms"} } } over {Z} } = { {"120"" V"} over {"190 " %OMEGA } } =0 "." "633"" A"} {} at 10.0 kHz

Discussion for (a)

The current at 60.0 Hz is the same (to three digits) as found for the capacitor alone in [link] . The capacitor dominates at low frequency. The current at 10.0 kHz is only slightly different from that found for the inductor alone in [link] . The inductor dominates at high frequency.

Got questions? Get instant answers now!

Resonance in RLC Series ac circuits

How does an RLC circuit behave as a function of the frequency of the driving voltage source? Combining Ohm’s law, I rms = V rms / Z size 12{I rSub { size 8{"rms"} } =V rSub { size 8{"rms"} } /Z} {} , and the expression for impedance Z from Z = R 2 + ( X L X C ) 2 size 12{Z= sqrt {R rSup { size 8{2} } + \( X rSub { size 8{L} } - X rSub { size 8{C} } \) rSup { size 8{2} } } } {} gives

I rms = V rms R 2 + ( X L X C ) 2 . size 12{I rSub { size 8{"rms"} } = { {V rSub { size 8{"rms"} } } over { sqrt {R rSup { size 8{2} } + \( X rSub { size 8{L} } - X rSub { size 8{C} } \) rSup { size 8{2} } } } } } {}

The reactances vary with frequency, with X L size 12{X rSub { size 8{L} } } {} large at high frequencies and X C size 12{X rSub { size 8{C} } } {} large at low frequencies, as we have seen in three previous examples. At some intermediate frequency f 0 size 12{f rSub { size 8{0} } } {} , the reactances will be equal and cancel, giving Z = R size 12{Z=R} {} —this is a minimum value for impedance, and a maximum value for I rms size 12{I rSub { size 8{"rms"} } } {} results. We can get an expression for f 0 size 12{f rSub { size 8{0} } } {} by taking

X L = X C . size 12{X rSub { size 8{L} } =X rSub { size 8{C} } } {}

Substituting the definitions of X L size 12{X rSub { size 8{L} } } {} and X C size 12{X rSub { size 8{C} } } {} ,

2 πf 0 L = 1 2 πf 0 C . size 12{2πf rSub { size 8{0} } L= { {1} over {2πf rSub { size 8{0} } C} } } {}

Solving this expression for f 0 size 12{f rSub { size 8{0} } } {} yields

f 0 = 1 LC , size 12{f rSub { size 8{0} } = { {1} over {2π sqrt { ital "LC"} } } } {}

where f 0 size 12{f rSub { size 8{0} } } {} is the resonant frequency    of an RLC series circuit. This is also the natural frequency at which the circuit would oscillate if not driven by the voltage source. At f 0 size 12{f rSub { size 8{0} } } {} , the effects of the inductor and capacitor cancel, so that Z = R size 12{Z=R} {} , and I rms size 12{I rSub { size 8{"rms"} } } {} is a maximum.

Questions & Answers

how do you get the 2/50
Abba Reply
number of sport play by 50 student construct discrete data
Aminu Reply
width of the frangebany leaves on how to write a introduction
Theresa Reply
Solve the mean of variance
Veronica Reply
Step 1: Find the mean. To find the mean, add up all the scores, then divide them by the number of scores. ... Step 2: Find each score's deviation from the mean. ... Step 3: Square each deviation from the mean. ... Step 4: Find the sum of squares. ... Step 5: Divide the sum of squares by n – 1 or N.
kenneth
what is error
Yakuba Reply
Is mistake done to something
Vutshila
Hy
anas
hy
What is the life teble
anas
hy
Jibrin
statistics is the analyzing of data
Tajudeen Reply
what is statics?
Zelalem Reply
how do you calculate mean
Gloria Reply
diveving the sum if all values
Shaynaynay
let A1,A2 and A3 events be independent,show that (A1)^c, (A2)^c and (A3)^c are independent?
Fisaye Reply
what is statistics
Akhisani Reply
data collected all over the world
Shaynaynay
construct a less than and more than table
Imad Reply
The sample of 16 students is taken. The average age in the sample was 22 years with astandard deviation of 6 years. Construct a 95% confidence interval for the age of the population.
Aschalew Reply
Bhartdarshan' is an internet-based travel agency wherein customer can see videos of the cities they plant to visit. The number of hits daily is a normally distributed random variable with a mean of 10,000 and a standard deviation of 2,400 a. what is the probability of getting more than 12,000 hits? b. what is the probability of getting fewer than 9,000 hits?
Akshay Reply
Bhartdarshan'is an internet-based travel agency wherein customer can see videos of the cities they plan to visit. The number of hits daily is a normally distributed random variable with a mean of 10,000 and a standard deviation of 2,400. a. What is the probability of getting more than 12,000 hits
Akshay
1
Bright
Sorry i want to learn more about this question
Bright
Someone help
Bright
a= 0.20233 b=0.3384
Sufiyan
a
Shaynaynay
How do I interpret level of significance?
Mohd Reply
It depends on your business problem or in Machine Learning you could use ROC- AUC cruve to decide the threshold value
Shivam
how skewness and kurtosis are used in statistics
Owen Reply
yes what is it
Taneeya
Got questions? Join the online conversation and get instant answers!
Jobilize.com Reply
Practice Key Terms 4

Get Jobilize Job Search Mobile App in your pocket Now!

Get it on Google Play Download on the App Store Now


Source:  OpenStax, College physics. OpenStax CNX. Jul 27, 2015 Download for free at http://legacy.cnx.org/content/col11406/1.9
Google Play and the Google Play logo are trademarks of Google Inc.

Notification Switch

Would you like to follow the 'College physics' conversation and receive update notifications?

Ask