<< Chapter < Page Chapter >> Page >
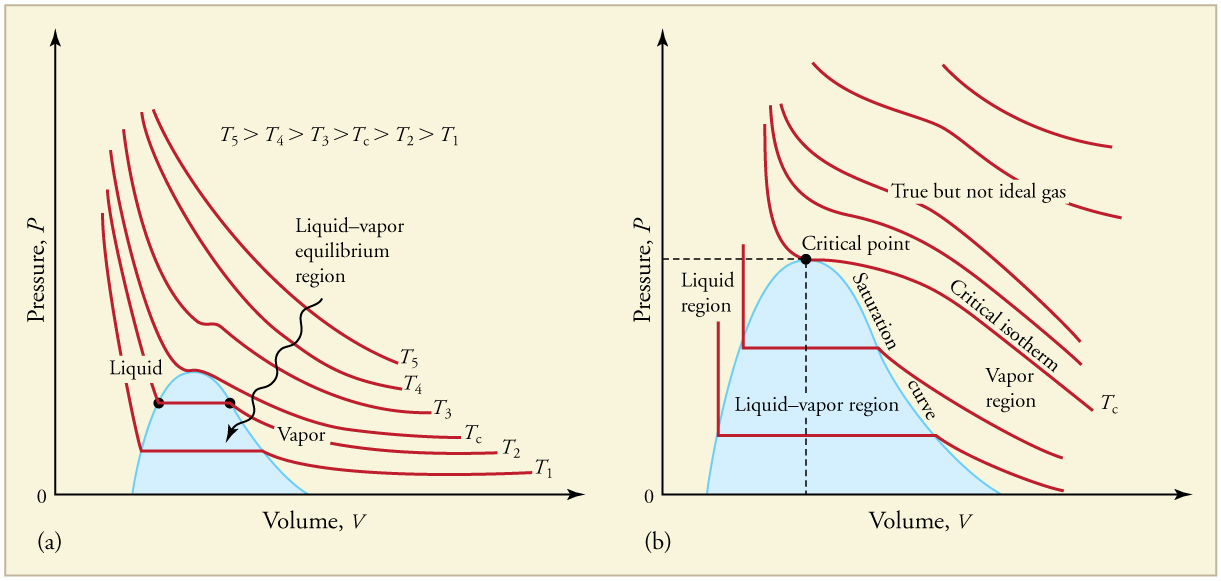
Graphs of pressure versus volume at six different temperatures, T one through T five and T critical. T one is the lowest temperature and T five is the highest. T critical is in the middle. Graphs show that pressure per unit volume is greater for greater temperatures. Pressure decreases with increasing volume for all temperatures, except at low temperatures when pressure is constant with increasing volume during a phase change.
PV size 12{ ital "PV"} {} diagrams. (a) Each curve (isotherm) represents the relationship between P size 12{P} {} and V size 12{V} {} at a fixed temperature; the upper curves are at higher temperatures. The lower curves are not hyperbolas, because the gas is no longer an ideal gas. (b) An expanded portion of the PV size 12{ ital "PV"} {} diagram for low temperatures, where the phase can change from a gas to a liquid. The term “vapor” refers to the gas phase when it exists at a temperature below the boiling temperature.
Critical temperatures and pressures
Substance Critical temperature Critical pressure
K size 12{K} {} º C size 12{°C} {} Pa size 12{"Pa"} {} atm size 12{"atm"} {}
Water 647.4 374.3 22 . 12 × 10 6 size 12{"22" "." "12"×"10" rSup { size 8{6} } } {} 219.0
Sulfur dioxide 430.7 157.6 7 . 88 × 10 6 size 12{7 "." "88" times "10" rSup { size 8{6} } } {} 78.0
Ammonia 405.5 132.4 11 . 28 × 10 6 size 12{"11" "." "28"×"10" rSup { size 8{6} } } {} 111.7
Carbon dioxide 304.2 31.1 7 . 39 × 10 6 size 12{7 "." "39"×"10" rSup { size 8{6} } } {} 73.2
Oxygen 154.8 −118.4 5 . 08 × 10 6 size 12{5 "." "08"×"10" rSup { size 8{6} } } {} 50.3
Nitrogen 126.2 −146.9 3 . 39 × 10 6 size 12{3 "." "39"×"10" rSup { size 8{6} } } {} 33.6
Hydrogen 33.3 −239.9 1 . 30 × 10 6 size 12{1 "." "30"×"10" rSup { size 8{6} } } {} 12.9
Helium 5.3 −267.9 0 . 229 × 10 6 size 12{0 "." "229" times "10" rSup { size 8{6} } } {} 2.27

Phase diagrams

The plots of pressure versus temperatures provide considerable insight into thermal properties of substances. There are well-defined regions on these graphs that correspond to various phases of matter, so PT size 12{ ital "PT"} {} graphs are called phase diagrams . [link] shows the phase diagram for water. Using the graph, if you know the pressure and temperature you can determine the phase of water. The solid lines—boundaries between phases—indicate temperatures and pressures at which the phases coexist (that is, they exist together in ratios, depending on pressure and temperature). For example, the boiling point of water is 100 º C size 12{"100"°C} {} at 1.00 atm. As the pressure increases, the boiling temperature rises steadily to 374 º C size 12{"374"°C} {} at a pressure of 218 atm. A pressure cooker (or even a covered pot) will cook food faster because the water can exist as a liquid at temperatures greater than 100 º C size 12{"100"°C} {} without all boiling away. The curve ends at a point called the critical point , because at higher temperatures the liquid phase does not exist at any pressure. The critical point occurs at the critical temperature, as you can see for water from [link] . The critical temperature for oxygen is 118 º C size 12{ +- "118"°C} {} , so oxygen cannot be liquefied above this temperature.
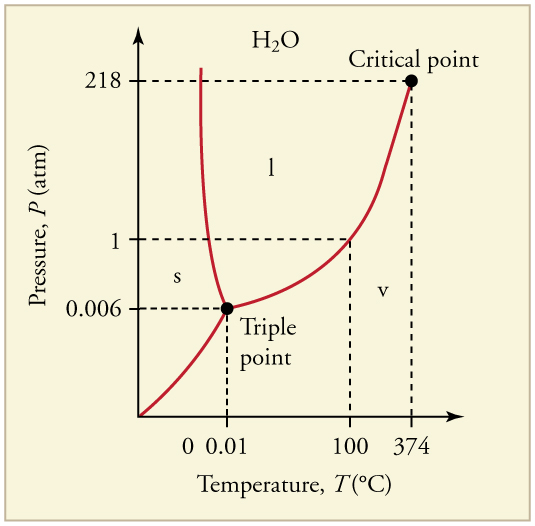
Graph of pressure versus temperature showing the boundaries of the three phases of water, along with the triple point and critical point. The triple point, where all three phases exist, is at 0 point 006 atmospheres and 0 point 01 degrees C. The critical point is at two hundred eighteen atmospheres and three hundred seventy four degrees C. Solid water is in the P T region generally to the left (lower temperature, lower or higher pressure, from the triple point). Liquid water is generally above and to the right of the triple point (higher pressure, higher temperature). The region of water vapor is to the lower right of the triple point (lower pressure and temperature to higher temperature and pressure).
The phase diagram ( PT size 12{ ital "PT"} {} graph) for water. Note that the axes are nonlinear and the graph is not to scale. This graph is simplified—there are several other exotic phases of ice at higher pressures.

Similarly, the curve between the solid and liquid regions in [link] gives the melting temperature at various pressures. For example, the melting point is 0 º C size 12{0°C} {} at 1.00 atm, as expected. Note that, at a fixed temperature, you can change the phase from solid (ice) to liquid (water) by increasing the pressure. Ice melts from pressure in the hands of a snowball maker. From the phase diagram, we can also say that the melting temperature of ice rises with increased pressure. When a car is driven over snow, the increased pressure from the tires melts the snowflakes; afterwards the water refreezes and forms an ice layer.

At sufficiently low pressures there is no liquid phase, but the substance can exist as either gas or solid. For water, there is no liquid phase at pressures below 0.00600 atm. The phase change from solid to gas is called sublimation    . It accounts for large losses of snow pack that never make it into a river, the routine automatic defrosting of a freezer, and the freeze-drying process applied to many foods. Carbon dioxide, on the other hand, sublimates at standard atmospheric pressure of 1 atm. (The solid form of CO 2 size 12{"CO" rSub { size 8{2} } } {} is known as dry ice because it does not melt. Instead, it moves directly from the solid to the gas state.)

Questions & Answers

how to study physic and understand
Ewa Reply
what is conservative force with examples
Moses
what is work
Fredrick Reply
the transfer of energy by a force that causes an object to be displaced; the product of the component of the force in the direction of the displacement and the magnitude of the displacement
AI-Robot
why is it from light to gravity
Esther Reply
difference between model and theory
Esther
Is the ship moving at a constant velocity?
Kamogelo Reply
The full note of modern physics
aluet Reply
introduction to applications of nuclear physics
aluet Reply
the explanation is not in full details
Moses Reply
I need more explanation or all about kinematics
Moses
yes
zephaniah
I need more explanation or all about nuclear physics
aluet
Show that the equal masses particles emarge from collision at right angle by making explicit used of fact that momentum is a vector quantity
Muhammad Reply
yh
Isaac
A wave is described by the function D(x,t)=(1.6cm) sin[(1.2cm^-1(x+6.8cm/st] what are:a.Amplitude b. wavelength c. wave number d. frequency e. period f. velocity of speed.
Majok Reply
what is frontier of physics
Somto Reply
A body is projected upward at an angle 45° 18minutes with the horizontal with an initial speed of 40km per second. In hoe many seconds will the body reach the ground then how far from the point of projection will it strike. At what angle will the horizontal will strike
Gufraan Reply
Suppose hydrogen and oxygen are diffusing through air. A small amount of each is released simultaneously. How much time passes before the hydrogen is 1.00 s ahead of the oxygen? Such differences in arrival times are used as an analytical tool in gas chromatography.
Ezekiel Reply
please explain
Samuel
what's the definition of physics
Mobolaji Reply
what is physics
Nangun Reply
the science concerned with describing the interactions of energy, matter, space, and time; it is especially interested in what fundamental mechanisms underlie every phenomenon
AI-Robot
what is isotopes
Nangun Reply
nuclei having the same Z and different N s
AI-Robot

Get Jobilize Job Search Mobile App in your pocket Now!

Get it on Google Play Download on the App Store Now


Source:  OpenStax, College physics. OpenStax CNX. Jul 27, 2015 Download for free at http://legacy.cnx.org/content/col11406/1.9
Google Play and the Google Play logo are trademarks of Google Inc.

Notification Switch

Would you like to follow the 'College physics' conversation and receive update notifications?

Ask