<< Chapter < Page Chapter >> Page >

Solution for Remaining Times

The procedures for calculating the position and velocity at t = 2 . 00 s size 12{t=2 "." "00"`s} {} and 3 . 00 s size 12{3 "." "00 s"} {} are the same as those above. The results are summarized in [link] and illustrated in [link] .

Results
Time, t Position, y Velocity, v Acceleration, a
1 . 00 s size 12{1 "." "00 s"} {} 8 . 10 m size 12{8 "." "10 m"} {} 3 . 20 m/s size 12{3 "." "20 m/s"} {} 9 . 80 m/s 2 size 12{-9 "." "80 m/s" rSup { size 8{2} } } {}
2 . 00 s size 12{2 "." "00 s"} {} 6 . 40 m size 12{6 "." "40 m"} {} 6 . 60 m/s size 12{ - 6 "." "60 m/s"} {} 9 . 80 m/s 2 size 12{-9 "." "80 m/s" rSup { size 8{2} } } {}
3 . 00 s size 12{3 "." "00 s"} {} 5 . 10 m size 12{ - 5 "." "10 m"} {} 16 . 4 m/s size 12{ - "16" "." "4 m/s"} {} 9 . 80 m/s 2 size 12{-9 "." "80 m/s" rSup { size 8{2} } } {}

Graphing the data helps us understand it more clearly.
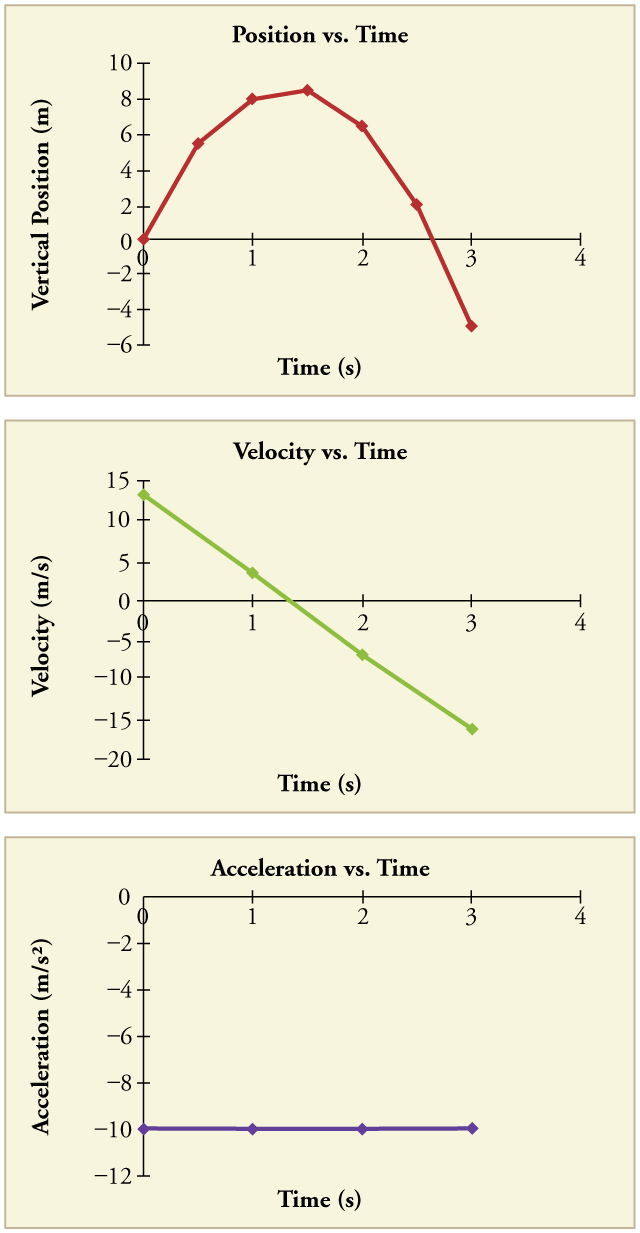
Three panels showing three graphs. The top panel shows a graph of vertical position in meters versus time in seconds. The line begins at the origin and has a positive slope that decreases over time until it hits a turning point between seconds 1 and 2. After that it has a negative slope that increases over time. The middle panel shows a graph of velocity in meters per second versus time in seconds. The line is straight, with a negative slope, beginning at time zero velocity of thirteen meters per second and ending at time 3 seconds with a velocity just over negative sixteen meters per second. The bottom panel shows a graph of acceleration in meters per second squared versus time in seconds. The line is straight and flat at a y value of negative 9 point 80 meters per second squared from time 0 to time 3 seconds.
Vertical position, vertical velocity, and vertical acceleration vs. time for a rock thrown vertically up at the edge of a cliff. Notice that velocity changes linearly with time and that acceleration is constant. Misconception Alert! Notice that the position vs. time graph shows vertical position only. It is easy to get the impression that the graph shows some horizontal motion—the shape of the graph looks like the path of a projectile. But this is not the case; the horizontal axis is time , not space. The actual path of the rock in space is straight up, and straight down.

Discussion

The interpretation of these results is important. At 1.00 s the rock is above its starting point and heading upward, since y 1 size 12{y rSub { size 8{1} } } {} and v 1 size 12{v rSub { size 8{1} } } {} are both positive. At 2.00 s, the rock is still above its starting point, but the negative velocity means it is moving downward. At 3.00 s, both y 3 size 12{y rSub { size 8{3} } } {} and v 3 size 12{v rSub { size 8{3} } } {} are negative, meaning the rock is below its starting point and continuing to move downward. Notice that when the rock is at its highest point (at 1.5 s), its velocity is zero, but its acceleration is still 9 . 80 m/s 2 size 12{-9 "." "80 m/s" rSup { size 8{2} } } {} . Its acceleration is 9 . 80 m/s 2 size 12{-9 "." "80 m/s" rSup { size 8{2} } } {} for the whole trip—while it is moving up and while it is moving down. Note that the values for y size 12{y} {} are the positions (or displacements) of the rock, not the total distances traveled. Finally, note that free-fall applies to upward motion as well as downward. Both have the same acceleration—the acceleration due to gravity, which remains constant the entire time. Astronauts training in the famous Vomit Comet, for example, experience free-fall while arcing up as well as down, as we will discuss in more detail later.

Making connections: take-home experiment—reaction time

A simple experiment can be done to determine your reaction time. Have a friend hold a ruler between your thumb and index finger, separated by about 1 cm. Note the mark on the ruler that is right between your fingers. Have your friend drop the ruler unexpectedly, and try to catch it between your two fingers. Note the new reading on the ruler. Assuming acceleration is that due to gravity, calculate your reaction time. How far would you travel in a car (moving at 30 m/s) if the time it took your foot to go from the gas pedal to the brake was twice this reaction time?

Calculating velocity of a falling object: a rock thrown down

What happens if the person on the cliff throws the rock straight down, instead of straight up? To explore this question, calculate the velocity of the rock when it is 5.10 m below the starting point, and has been thrown downward with an initial speed of 13.0 m/s.

Strategy

Draw a sketch.

Velocity vector arrow pointing down in the negative y direction and labeled v sub zero equals negative thirteen point 0 meters per second. Acceleration vector arrow also pointing down in the negative y direction, labeled a equals negative 9 point 80 meters per second squared.

Since up is positive, the final position of the rock will be negative because it finishes below the starting point at y 0 = 0 size 12{y rSub { size 8{0} } =0} {} . Similarly, the initial velocity is downward and therefore negative, as is the acceleration due to gravity. We expect the final velocity to be negative since the rock will continue to move downward.

Questions & Answers

how do you get the 2/50
Abba Reply
number of sport play by 50 student construct discrete data
Aminu Reply
width of the frangebany leaves on how to write a introduction
Theresa Reply
Solve the mean of variance
Veronica Reply
Step 1: Find the mean. To find the mean, add up all the scores, then divide them by the number of scores. ... Step 2: Find each score's deviation from the mean. ... Step 3: Square each deviation from the mean. ... Step 4: Find the sum of squares. ... Step 5: Divide the sum of squares by n – 1 or N.
kenneth
what is error
Yakuba Reply
Is mistake done to something
Vutshila
Hy
anas
hy
What is the life teble
anas
hy
Jibrin
statistics is the analyzing of data
Tajudeen Reply
what is statics?
Zelalem Reply
how do you calculate mean
Gloria Reply
diveving the sum if all values
Shaynaynay
let A1,A2 and A3 events be independent,show that (A1)^c, (A2)^c and (A3)^c are independent?
Fisaye Reply
what is statistics
Akhisani Reply
data collected all over the world
Shaynaynay
construct a less than and more than table
Imad Reply
The sample of 16 students is taken. The average age in the sample was 22 years with astandard deviation of 6 years. Construct a 95% confidence interval for the age of the population.
Aschalew Reply
Bhartdarshan' is an internet-based travel agency wherein customer can see videos of the cities they plant to visit. The number of hits daily is a normally distributed random variable with a mean of 10,000 and a standard deviation of 2,400 a. what is the probability of getting more than 12,000 hits? b. what is the probability of getting fewer than 9,000 hits?
Akshay Reply
Bhartdarshan'is an internet-based travel agency wherein customer can see videos of the cities they plan to visit. The number of hits daily is a normally distributed random variable with a mean of 10,000 and a standard deviation of 2,400. a. What is the probability of getting more than 12,000 hits
Akshay
1
Bright
Sorry i want to learn more about this question
Bright
Someone help
Bright
a= 0.20233 b=0.3384
Sufiyan
a
Shaynaynay
How do I interpret level of significance?
Mohd Reply
It depends on your business problem or in Machine Learning you could use ROC- AUC cruve to decide the threshold value
Shivam
how skewness and kurtosis are used in statistics
Owen Reply
yes what is it
Taneeya
Got questions? Join the online conversation and get instant answers!
Jobilize.com Reply
Practice Key Terms 2

Get Jobilize Job Search Mobile App in your pocket Now!

Get it on Google Play Download on the App Store Now


Source:  OpenStax, College physics. OpenStax CNX. Jul 27, 2015 Download for free at http://legacy.cnx.org/content/col11406/1.9
Google Play and the Google Play logo are trademarks of Google Inc.

Notification Switch

Would you like to follow the 'College physics' conversation and receive update notifications?

Ask