<< Chapter < Page Chapter >> Page >

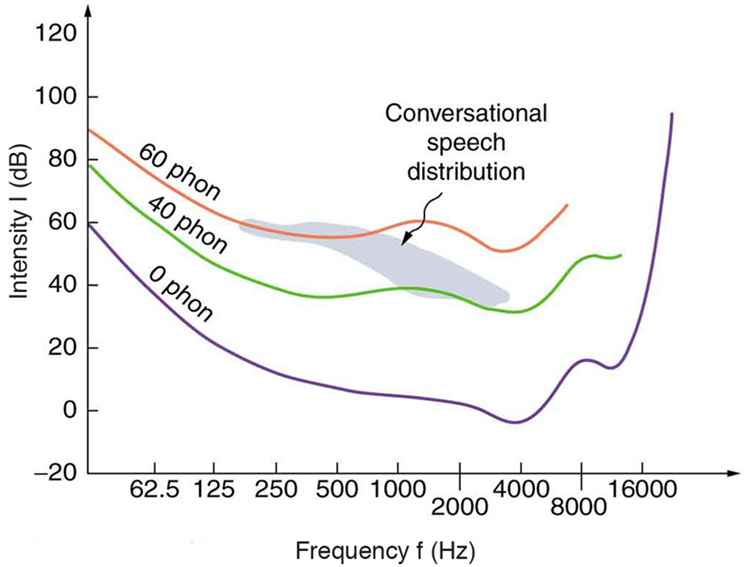
Further examination of the graph in [link] reveals some interesting facts about human hearing. First, sounds below the 0-phon curve are not perceived by most people. So, for example, a 60 Hz sound at 40 dB is inaudible. The 0-phon curve represents the threshold of normal hearing. We can hear some sounds at intensity levels below 0 dB. For example, a 3-dB, 5000-Hz sound is audible, because it lies above the 0-phon curve. The loudness curves all have dips in them between about 2000 and 5000 Hz. These dips mean the ear is most sensitive to frequencies in that range. For example, a 15-dB sound at 4000 Hz has a loudness of 20 phons, the same as a 20-dB sound at 1000 Hz. The curves rise at both extremes of the frequency range, indicating that a greater-intensity level sound is needed at those frequencies to be perceived to be as loud as at middle frequencies. For example, a sound at 10,000 Hz must have an intensity level of 30 dB to seem as loud as a 20 dB sound at 1000 Hz. Sounds above 120 phons are painful as well as damaging.

We do not often utilize our full range of hearing. This is particularly true for frequencies above 8000 Hz, which are rare in the environment and are unnecessary for understanding conversation or appreciating music. In fact, people who have lost the ability to hear such high frequencies are usually unaware of their loss until tested. The shaded region in [link] is the frequency and intensity region where most conversational sounds fall. The curved lines indicate what effect hearing losses of 40 and 60 phons will have. A 40-phon hearing loss at all frequencies still allows a person to understand conversation, although it will seem very quiet. A person with a 60-phon loss at all frequencies will hear only the lowest frequencies and will not be able to understand speech unless it is much louder than normal. Even so, speech may seem indistinct, because higher frequencies are not as well perceived. The conversational speech region also has a gender component, in that female voices are usually characterized by higher frequencies. So the person with a 60-phon hearing impediment might have difficulty understanding the normal conversation of a woman.

A graph of variation of intensity versus frequency is shown. The intensity in decibel is along Y axis and frequency is along X axis. There are three curves each for some count on phon zero, forty and sixty. The graphs are similar in shape but rising in value with increase in phon. The graph has an initial fall from maximum value on Y axis reaches a minimum and then there is a wavy rise. The conversational speech distribution is shown as a strip across the graph.
The shaded region represents frequencies and intensity levels found in normal conversational speech. The 0-phon line represents the normal hearing threshold, while those at 40 and 60 represent thresholds for people with 40- and 60-phon hearing losses, respectively.

Hearing tests are performed over a range of frequencies, usually from 250 to 8000 Hz, and can be displayed graphically in an audiogram like that in [link] . The hearing threshold is measured in dB relative to the normal threshold , so that normal hearing registers as 0 dB at all frequencies. Hearing loss caused by noise typically shows a dip near the 4000 Hz frequency, irrespective of the frequency that caused the loss and often affects both ears. The most common form of hearing loss comes with age and is called presbycusis —literally elder ear. Such loss is increasingly severe at higher frequencies, and interferes with music appreciation and speech recognition.

Questions & Answers

what is phylogeny
Odigie Reply
evolutionary history and relationship of an organism or group of organisms
AI-Robot
ok
Deng
what is biology
Hajah Reply
the study of living organisms and their interactions with one another and their environments
AI-Robot
what is biology
Victoria Reply
HOW CAN MAN ORGAN FUNCTION
Alfred Reply
the diagram of the digestive system
Assiatu Reply
allimentary cannel
Ogenrwot
How does twins formed
William Reply
They formed in two ways first when one sperm and one egg are splited by mitosis or two sperm and two eggs join together
Oluwatobi
what is genetics
Josephine Reply
Genetics is the study of heredity
Misack
how does twins formed?
Misack
What is manual
Hassan Reply
discuss biological phenomenon and provide pieces of evidence to show that it was responsible for the formation of eukaryotic organelles
Joseph Reply
what is biology
Yousuf Reply
the study of living organisms and their interactions with one another and their environment.
Wine
discuss the biological phenomenon and provide pieces of evidence to show that it was responsible for the formation of eukaryotic organelles in an essay form
Joseph Reply
what is the blood cells
Shaker Reply
list any five characteristics of the blood cells
Shaker
lack electricity and its more savely than electronic microscope because its naturally by using of light
Abdullahi Reply
advantage of electronic microscope is easily and clearly while disadvantage is dangerous because its electronic. advantage of light microscope is savely and naturally by sun while disadvantage is not easily,means its not sharp and not clear
Abdullahi
cell theory state that every organisms composed of one or more cell,cell is the basic unit of life
Abdullahi
is like gone fail us
DENG
cells is the basic structure and functions of all living things
Ramadan
What is classification
ISCONT Reply
is organisms that are similar into groups called tara
Yamosa
in what situation (s) would be the use of a scanning electron microscope be ideal and why?
Kenna Reply
A scanning electron microscope (SEM) is ideal for situations requiring high-resolution imaging of surfaces. It is commonly used in materials science, biology, and geology to examine the topography and composition of samples at a nanoscale level. SEM is particularly useful for studying fine details,
Hilary
Got questions? Join the online conversation and get instant answers!
Jobilize.com Reply
Practice Key Terms 7

Get Jobilize Job Search Mobile App in your pocket Now!

Get it on Google Play Download on the App Store Now


Source:  OpenStax, College physics. OpenStax CNX. Jul 27, 2015 Download for free at http://legacy.cnx.org/content/col11406/1.9
Google Play and the Google Play logo are trademarks of Google Inc.

Notification Switch

Would you like to follow the 'College physics' conversation and receive update notifications?

Ask