<< Chapter < Page Chapter >> Page >

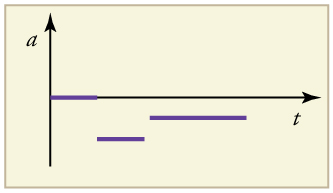
A graph of velocity vs. time of a ship coming into a harbor is shown below. (a) Describe the motion of the ship based on the graph. (b)What would a graph of the ship's acceleration look like?

Line graph of velocity versus time. The line has three legs. The first leg is flat. The second leg has a negative slope. The third leg also has a negative slope, but the slope is not as negative as the second leg.

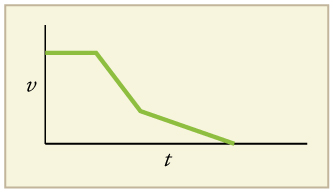
(a) The ship moves at constant velocity and then begins to decelerate at a constant rate. At some point, its deceleration rate decreases. It maintains this lower deceleration rate until it stops moving.

(b) A graph of acceleration vs. time would show zero acceleration in the first leg, large and constant negative acceleration in the second leg, and constant negative acceleration.

A line graph of acceleration versus time. There are three legs of the graph. All three legs are flat and straight. The first leg shows constant acceleration of 0. The second leg shows a constant negative acceleration. The third leg shows a constant negative acceleration that is not as negative as the second leg.
Got questions? Get instant answers now!

Section summary

  • Graphs of motion can be used to analyze motion.
  • Graphical solutions yield identical solutions to mathematical methods for deriving motion equations.
  • The slope of a graph of displacement x size 12{x} {} vs. time t size 12{t} {} is velocity v size 12{v} {} .
  • The slope of a graph of velocity v size 12{v} {} vs. time t size 12{t} {} graph is acceleration a size 12{a} {} .
  • Average velocity, instantaneous velocity, and acceleration can all be obtained by analyzing graphs.

Conceptual questions

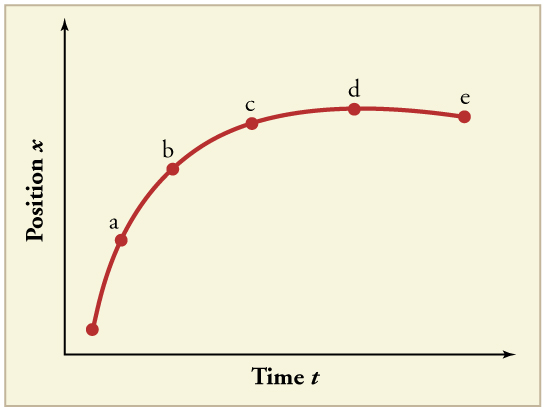
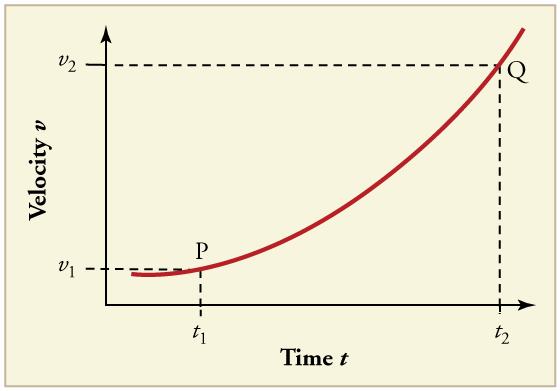
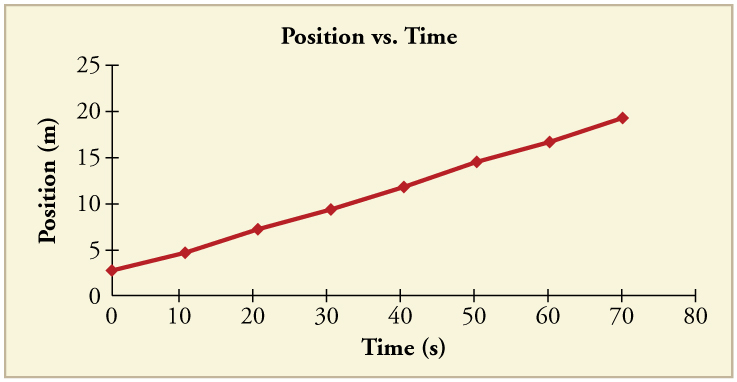
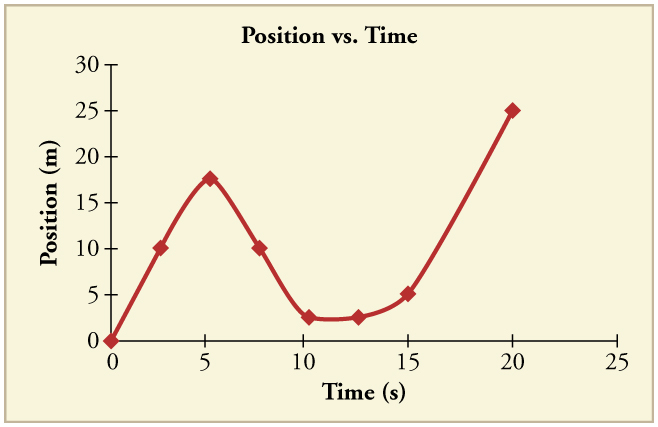
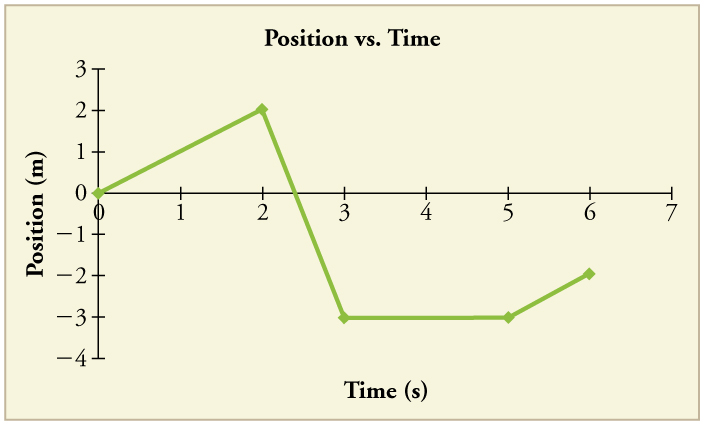
(a) Explain how you can use the graph of position versus time in [link] to describe the change in velocity over time. Identify (b) the time ( t a , t b , t c , t d , or t e ) at which the instantaneous velocity is greatest, (c) the time at which it is zero, and (d) the time at which it is negative.

Line graph of position versus time with 5 points labeled: a, b, c, d, and e. The slope of the line changes. It begins with a positive slope that decreases over time until around point d, where it is flat. It then has a slightly negative slope.
Got questions? Get instant answers now!

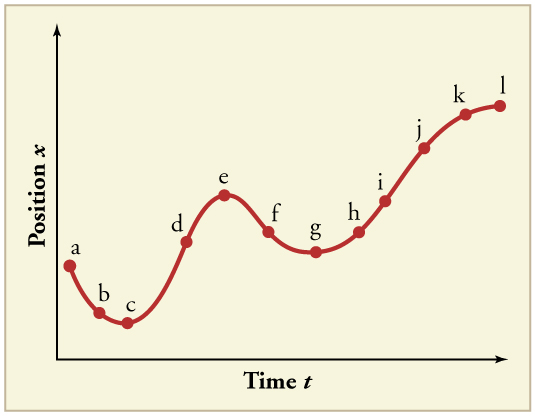
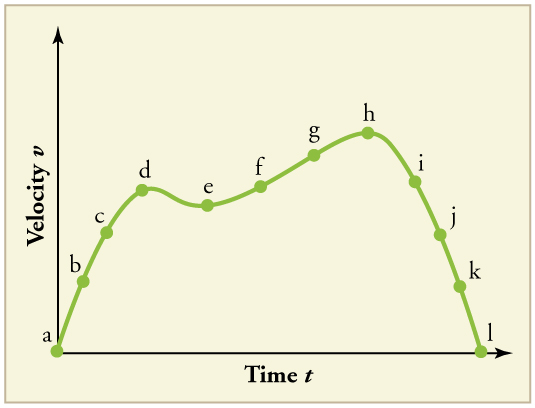
(a) Sketch a graph of velocity versus time corresponding to the graph of displacement versus time given in [link] . (b) Identify the time or times ( t a , t b , t c , etc.) at which the instantaneous velocity is greatest. (c) At which times is it zero? (d) At which times is it negative?

Line graph of position over time with 12 points labeled a through l. Line has a negative slope from a to c, where it turns and has a positive slope till point e. It turns again and has a negative slope till point g. The slope then increases again till l, where it flattens out.
Got questions? Get instant answers now!

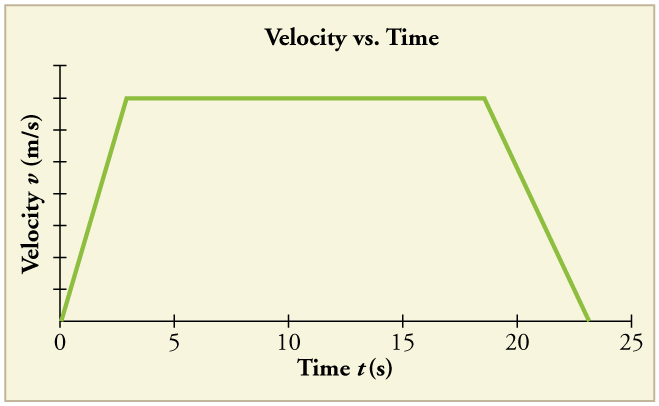
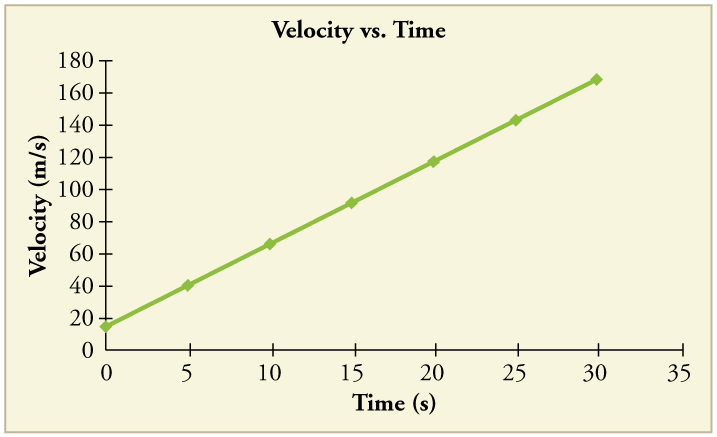
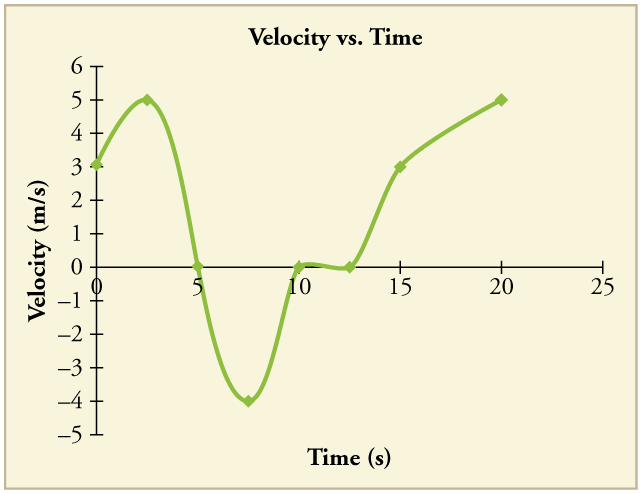
(a) Explain how you can determine the acceleration over time from a velocity versus time graph such as the one in [link] . (b) Based on the graph, how does acceleration change over time?

Line graph of velocity over time with two points labeled. Point P is at v 1 t 1. Point Q is at v 2 t 2. The line has a positive slope that increases over time.
Got questions? Get instant answers now!

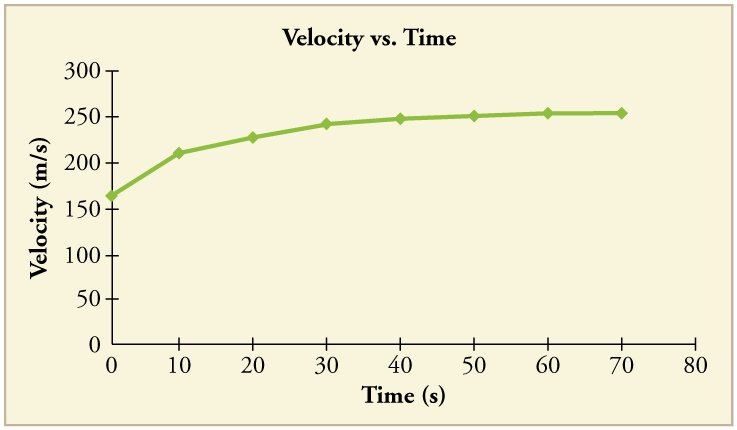
(a) Sketch a graph of acceleration versus time corresponding to the graph of velocity versus time given in [link] . (b) Identify the time or times ( t a , t b , t c , etc.) at which the acceleration is greatest. (c) At which times is it zero? (d) At which times is it negative?

Line graph of velocity over time with 12 points labeled a through l. The line has a positive slope from a at the origin to d where it slopes downward to e, and then back upward to h. It then slopes back down to point l at v equals 0.

Got questions? Get instant answers now!

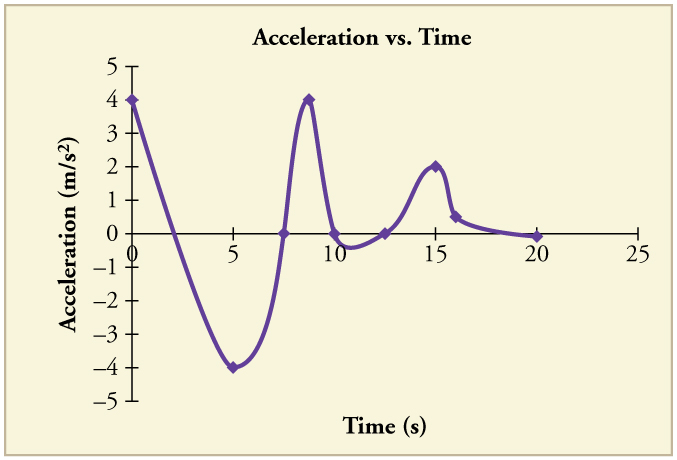
Consider the velocity vs. time graph of a person in an elevator shown in [link] . Suppose the elevator is initially at rest. It then accelerates for 3 seconds, maintains that velocity for 15 seconds, then decelerates for 5 seconds until it stops. The acceleration for the entire trip is not constant so we cannot use the equations of motion from Motion Equations for Constant Acceleration in One Dimension for the complete trip. (We could, however, use them in the three individual sections where acceleration is a constant.) Sketch graphs of (a) position vs. time and (b) acceleration vs. time for this trip.

Line graph of velocity versus time. Line begins at the origin and has a positive slope until it reaches 3 meters per second at 3 seconds. The slope is then zero until 18 seconds, where it becomes negative until the line reaches a velocity of 0 at 23 seconds.
Got questions? Get instant answers now!

A cylinder is given a push and then rolls up an inclined plane. If the origin is the starting point, sketch the position, velocity, and acceleration of the cylinder vs. time as it goes up and then down the plane.

Got questions? Get instant answers now!

Problems&Exercises

Note: There is always uncertainty in numbers taken from graphs. If your answers differ from expected values, examine them to see if they are within data extraction uncertainties estimated by you.

(a) By taking the slope of the curve in [link] , verify that the velocity of the jet car is 115 m/s at t = 20 s size 12{t="20"`s} {} . (b) By taking the slope of the curve at any point in [link] , verify that the jet car's acceleration is 5 . 0 m/s 2 size 12{5 "." "0 m/s" rSup { size 8{2} } } {} .

Line graph of position over time. Line has positive slope that increases over time.
Line graph of velocity versus time. Line is straight with a positive slope.

(a) 115 m/s size 12{"115 m/s"} {}

(b) 5 . 0 m/s 2 size 12{5 "." "0 m/s" rSup { size 8{2} } } {}

Got questions? Get instant answers now!

Using approximate values, calculate the slope of the curve in [link] to verify that the velocity at t = 10.0 s size 12{t="10"`s} {} is 0.208 m/s. Assume all values are known to 3 significant figures.

Line graph of position versus time. Line is straight with a positive slope.
Got questions? Get instant answers now!

Using approximate values, calculate the slope of the curve in [link] to verify that the velocity at t = 30.0 s is 0.238 m/s. Assume all values are known to 3 significant figures.

v = ( 11.7 6.95 ) × 10 3 m ( 40 . 0 – 20 .0 ) s = 238 m/s

Got questions? Get instant answers now!

By taking the slope of the curve in [link] , verify that the acceleration is approximately 3 . 2 m /s 2 at t = 10 s size 12{t="10"`s} {} .

Line graph of velocity versus time. Line has a positive slope that decreases over time until the line flattens out.
Got questions? Get instant answers now!

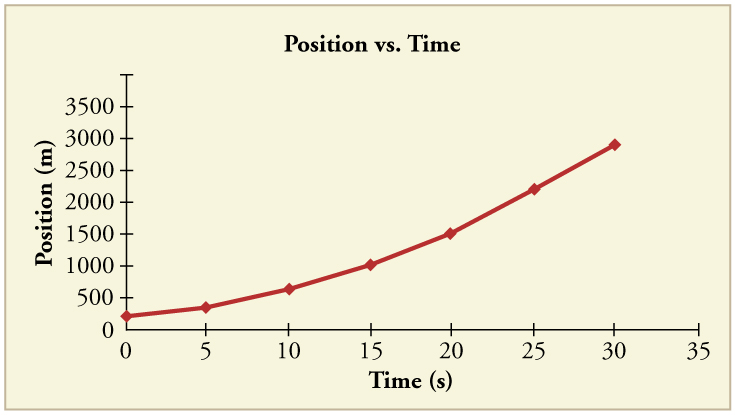
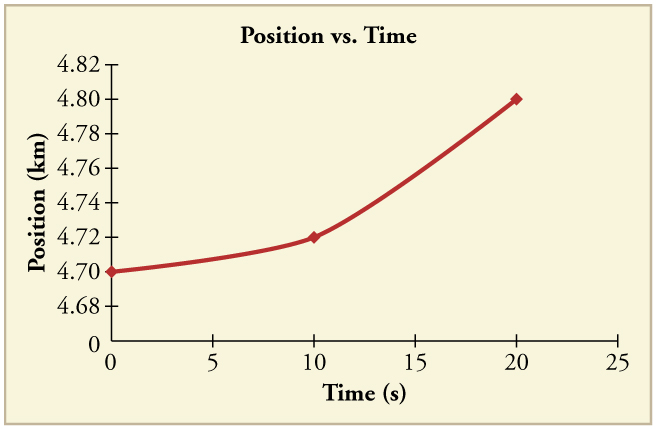
Construct the displacement graph for the subway shuttle train as shown in [link] (a). Your graph should show the position of the train, in kilometers, from t = 0 to 20 s. You will need to use the information on acceleration and velocity given in the examples for this figure.

Line graph of position versus time. Line begins with a slight positive slope. It then kinks to a much greater positive slope.
Got questions? Get instant answers now!

(a) Take the slope of the curve in [link] to find the jogger's velocity at t = 2 . 5 s size 12{t=2 "." 5`s} {} . (b) Repeat at 7.5 s. These values must be consistent with the graph in [link] .

Line graph of position over time. Line begins sloping upward, then kinks back down, then kinks back upward again.
Line graph of velocity over time. Line begins with a positive slope, then kinks downward with a negative slope, then kinks back upward again. It kinks back down again slightly, then back up again, and ends with a slightly less positive slope.
Got questions? Get instant answers now!

A graph of v t is shown for a world-class track sprinter in a 100-m race. (See [link] ). (a) What is his average velocity for the first 4 s? (b) What is his instantaneous velocity at t = 5 s ? (c) What is his average acceleration between 0 and 4 s? (d) What is his time for the race?
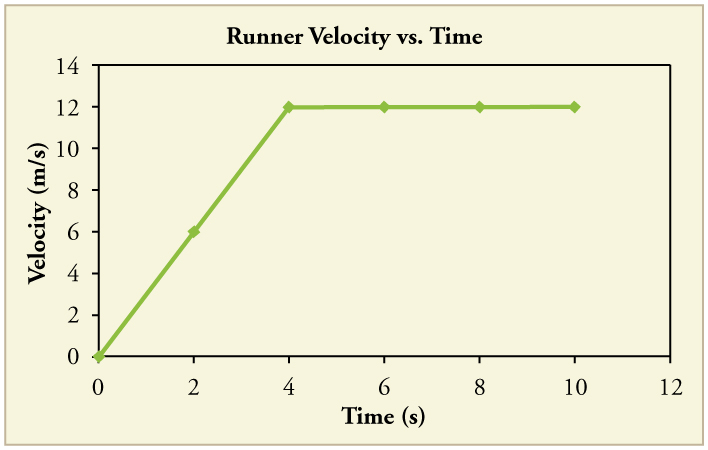
Line graph of velocity versus time. The line has two legs. The first has a constant positive slope. The second is flat, with a slope of 0.

(a) 6 m/s

(b) 12 m/s

(c) 3 m/s 2 size 12{"3 m/s" rSup { size 8{2} } } {}

(d) 10 s

Got questions? Get instant answers now!

[link] shows the displacement graph for a particle for 5 s. Draw the corresponding velocity and acceleration graphs.

Line graph of position versus time. The line has 4 legs. The first leg has a positive slope. The second leg has a negative slope. The third has a slope of 0. The fourth has a positive slope.
Got questions? Get instant answers now!

Questions & Answers

A golfer on a fairway is 70 m away from the green, which sits below the level of the fairway by 20 m. If the golfer hits the ball at an angle of 40° with an initial speed of 20 m/s, how close to the green does she come?
Aislinn Reply
cm
tijani
what is titration
John Reply
what is physics
Siyaka Reply
A mouse of mass 200 g falls 100 m down a vertical mine shaft and lands at the bottom with a speed of 8.0 m/s. During its fall, how much work is done on the mouse by air resistance
Jude Reply
Can you compute that for me. Ty
Jude
what is the dimension formula of energy?
David Reply
what is viscosity?
David
what is inorganic
emma Reply
what is chemistry
Youesf Reply
what is inorganic
emma
Chemistry is a branch of science that deals with the study of matter,it composition,it structure and the changes it undergoes
Adjei
please, I'm a physics student and I need help in physics
Adjanou
chemistry could also be understood like the sexual attraction/repulsion of the male and female elements. the reaction varies depending on the energy differences of each given gender. + masculine -female.
Pedro
A ball is thrown straight up.it passes a 2.0m high window 7.50 m off the ground on it path up and takes 1.30 s to go past the window.what was the ball initial velocity
Krampah Reply
2. A sled plus passenger with total mass 50 kg is pulled 20 m across the snow (0.20) at constant velocity by a force directed 25° above the horizontal. Calculate (a) the work of the applied force, (b) the work of friction, and (c) the total work.
Sahid Reply
you have been hired as an espert witness in a court case involving an automobile accident. the accident involved car A of mass 1500kg which crashed into stationary car B of mass 1100kg. the driver of car A applied his brakes 15 m before he skidded and crashed into car B. after the collision, car A s
Samuel Reply
can someone explain to me, an ignorant high school student, why the trend of the graph doesn't follow the fact that the higher frequency a sound wave is, the more power it is, hence, making me think the phons output would follow this general trend?
Joseph Reply
Nevermind i just realied that the graph is the phons output for a person with normal hearing and not just the phons output of the sound waves power, I should read the entire thing next time
Joseph
Follow up question, does anyone know where I can find a graph that accuretly depicts the actual relative "power" output of sound over its frequency instead of just humans hearing
Joseph
"Generation of electrical energy from sound energy | IEEE Conference Publication | IEEE Xplore" ***ieeexplore.ieee.org/document/7150687?reload=true
Ryan
what's motion
Maurice Reply
what are the types of wave
Maurice
answer
Magreth
progressive wave
Magreth
hello friend how are you
Muhammad Reply
fine, how about you?
Mohammed
hi
Mujahid
A string is 3.00 m long with a mass of 5.00 g. The string is held taut with a tension of 500.00 N applied to the string. A pulse is sent down the string. How long does it take the pulse to travel the 3.00 m of the string?
yasuo Reply
Who can show me the full solution in this problem?
Reofrir Reply
Got questions? Join the online conversation and get instant answers!
Jobilize.com Reply
Practice Key Terms 4

Get Jobilize Job Search Mobile App in your pocket Now!

Get it on Google Play Download on the App Store Now


Source:  OpenStax, College physics for ap® courses. OpenStax CNX. Nov 04, 2016 Download for free at https://legacy.cnx.org/content/col11844/1.14
Google Play and the Google Play logo are trademarks of Google Inc.

Notification Switch

Would you like to follow the 'College physics for ap® courses' conversation and receive update notifications?

Ask