

| << Chapter < Page | Chapter >> Page > |
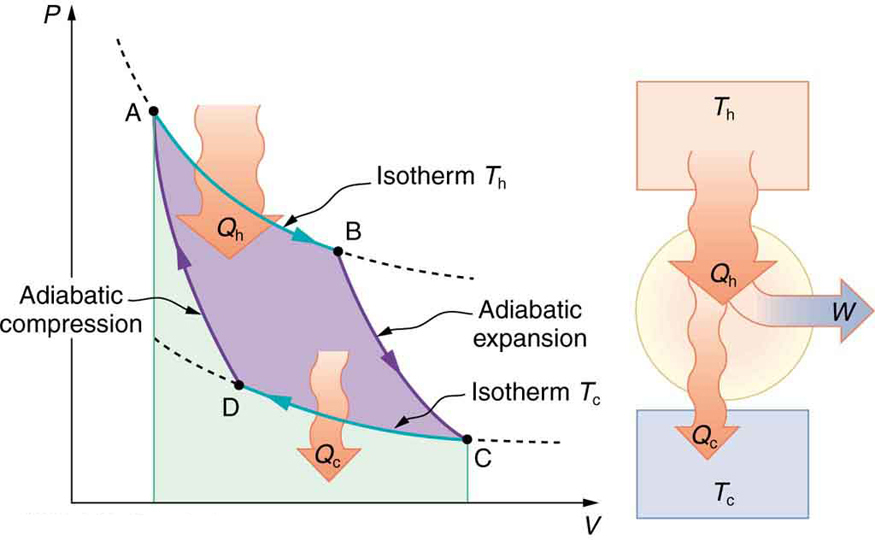
where and are in kelvins (or any other absolute temperature scale). No real heat engine can do as well as the Carnot efficiency—an actual efficiency of about 0.7 of this maximum is usually the best that can be accomplished. But the ideal Carnot engine, like the drinking bird above, while a fascinating novelty, has zero power. This makes it unrealistic for any applications.
Carnot's interesting result implies that 100% efficiency would be possible only if —that is, only if the cold reservoir were at absolute zero, a practical and theoretical impossibility. But the physical implication is this—the only way to have all heat transfer go into doing work is to remove all thermal energy, and this requires a cold reservoir at absolute zero.
It is also apparent that the greatest efficiencies are obtained when the ratio is as small as possible. Just as discussed for the Otto cycle in the previous section, this means that efficiency is greatest for the highest possible temperature of the hot reservoir and lowest possible temperature of the cold reservoir. (This setup increases the area inside the closed loop on the diagram; also, it seems reasonable that the greater the temperature difference, the easier it is to divert the heat transfer to work.) The actual reservoir temperatures of a heat engine are usually related to the type of heat source and the temperature of the environment into which heat transfer occurs. Consider the following example.
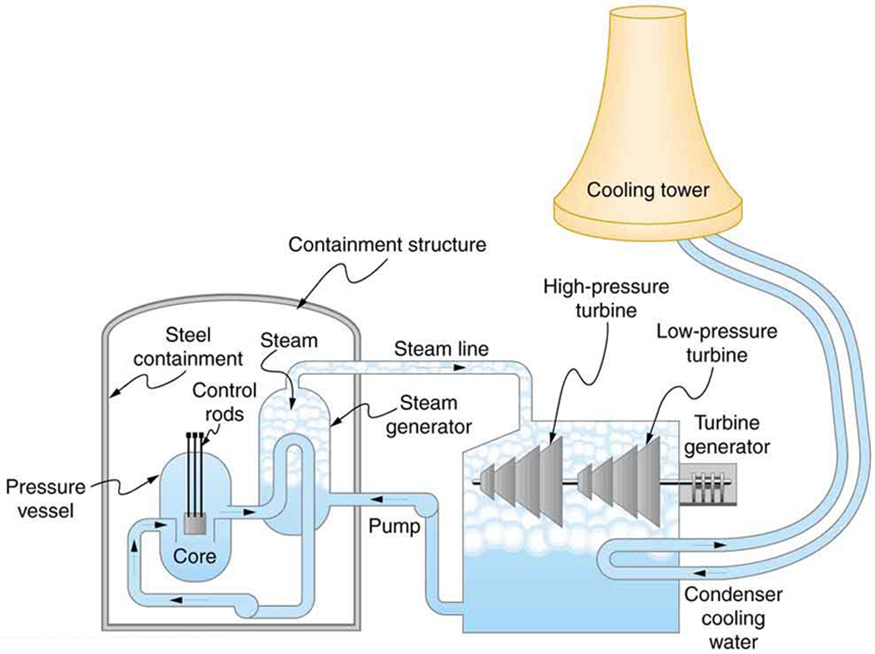
A nuclear power reactor has pressurized water at . (Higher temperatures are theoretically possible but practically not, due to limitations with materials used in the reactor.) Heat transfer from this water is a complex process (see [link] ). Steam, produced in the steam generator, is used to drive the turbine-generators. Eventually the steam is condensed to water at and then heated again to start the cycle over. Calculate the maximum theoretical efficiency for a heat engine operating between these two temperatures.
Notification Switch
Would you like to follow the 'College physics for ap® courses' conversation and receive update notifications?

|
|
|
|
|

|
|

|
|

|
|

|
|

|
|

|
|

|
|
|
|
|

|
|

|