

| << Chapter < Page | Chapter >> Page > |
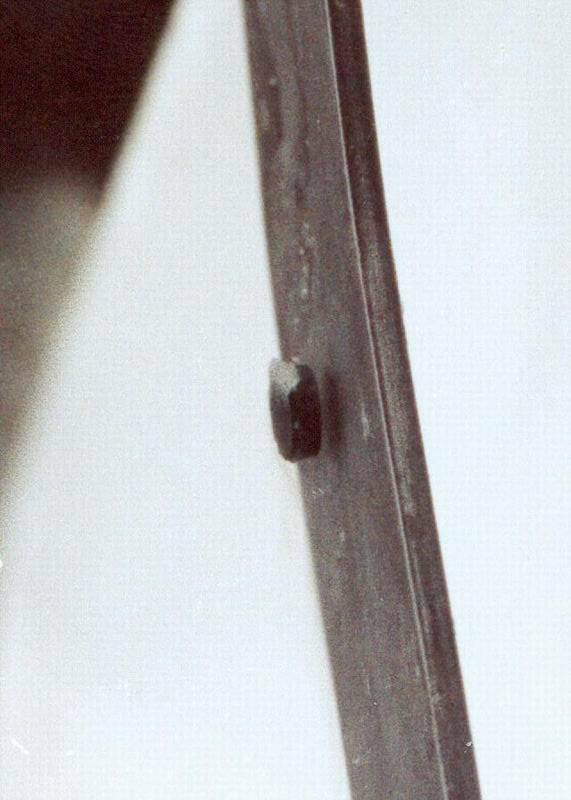
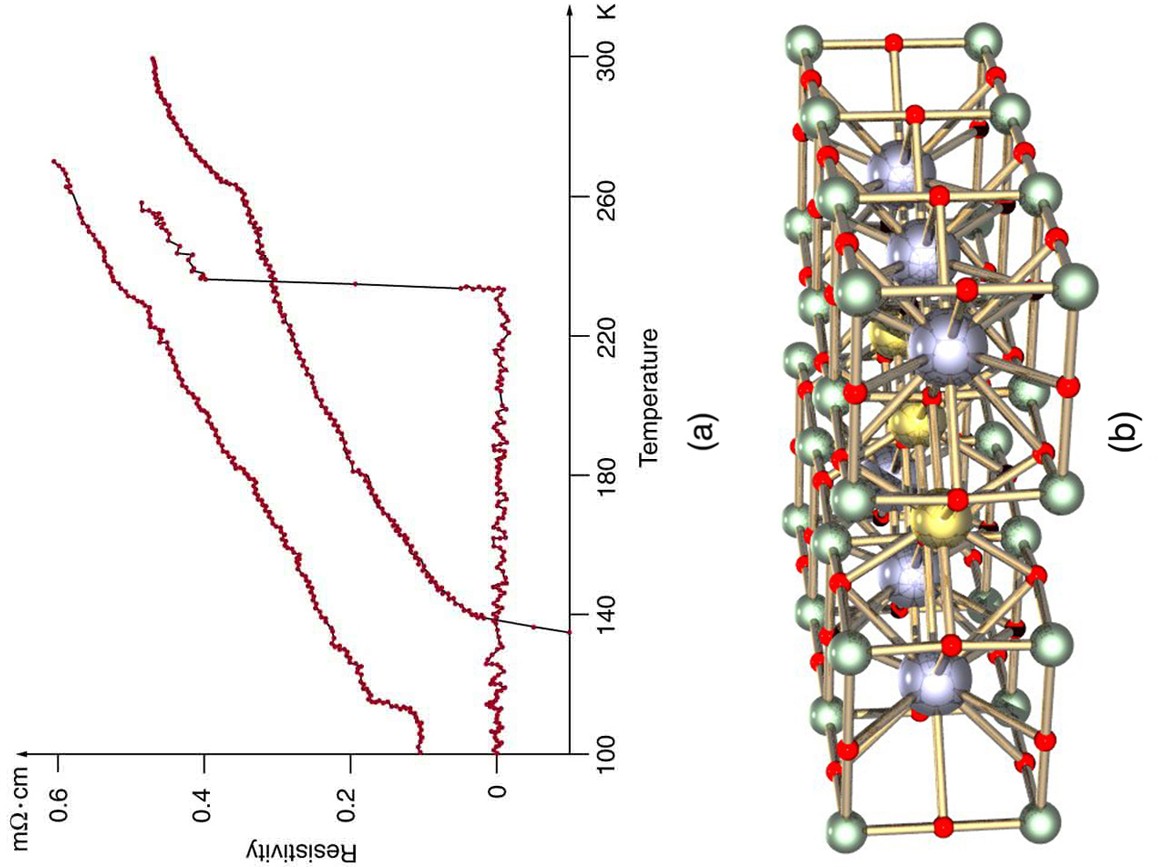
The search is on for even higher superconductors, many of complex and exotic copper oxide ceramics, sometimes including strontium, mercury, or yttrium as well as barium, calcium, and other elements. Room temperature (about 293 K) would be ideal, but any temperature close to room temperature is relatively cheap to produce and maintain. There are persistent reports of s over 200 K and some in the vicinity of 270 K. Unfortunately, these observations are not routinely reproducible, with samples losing their superconducting nature once heated and recooled (cycled) a few times (see [link] .) They are now called USOs or unidentified superconducting objects, out of frustration and the refusal of some samples to show high even though produced in the same manner as others. Reproducibility is crucial to discovery, and researchers are justifiably reluctant to claim the breakthrough they all seek. Time will tell whether USOs are real or an experimental quirk.
The theory of ordinary superconductors is difficult, involving quantum effects for widely separated electrons traveling through a material. Electrons couple in a manner that allows them to get through the material without losing energy to it, making it a superconductor. High- superconductors are more difficult to understand theoretically, but theorists seem to be closing in on a workable theory. The difficulty of understanding how electrons can sneak through materials without losing energy in collisions is even greater at higher temperatures, where vibrating atoms should get in the way. Discoverers of high may feel something analogous to what a politician once said upon an unexpected election victory—“I wonder what we did right?”
What is critical temperature ? Do all materials have a critical temperature? Explain why or why not.
Explain how good thermal contact with liquid nitrogen can keep objects at a temperature of 77 K (liquid nitrogen's boiling point at atmospheric pressure).
Not only is liquid nitrogen a cheaper coolant than liquid helium, its boiling point is higher (77 K vs. 4.2 K). How does higher temperature help lower the cost of cooling a material? Explain in terms of the rate of heat transfer being related to the temperature difference between the sample and its surroundings.
A section of superconducting wire carries a current of 100 A and requires 1.00 L of liquid nitrogen per hour to keep it below its critical temperature. For it to be economically advantageous to use a superconducting wire, the cost of cooling the wire must be less than the cost of energy lost to heat in the wire. Assume that the cost of liquid nitrogen is $0.30 per liter, and that electric energy costs $0.10 per kW·h. What is the resistance of a normal wire that costs as much in wasted electric energy as the cost of liquid nitrogen for the superconductor?
Notification Switch
Would you like to follow the 'College physics for ap® courses' conversation and receive update notifications?

|
|
|
|
|

|
|

|
|

|
|

|
|

|
|

|
|

|
|

|
|

|
|
|
|