<< Chapter < Page Chapter >> Page >
  • Define Doppler effect, Doppler shift, and sonic boom.
  • Calculate the frequency of a sound heard by someone observing Doppler shift.
  • Describe the sounds produced by objects moving faster than the speed of sound.

The characteristic sound of a motorcycle buzzing by is an example of the Doppler effect    . The high-pitch scream shifts dramatically to a lower-pitch roar as the motorcycle passes by a stationary observer. The closer the motorcycle brushes by, the more abrupt the shift. The faster the motorcycle moves, the greater the shift. We also hear this characteristic shift in frequency for passing race cars, airplanes, and trains. It is so familiar that it is used to imply motion and children often mimic it in play.

The Doppler effect is an alteration in the observed frequency of a sound due to motion of either the source or the observer. Although less familiar, this effect is easily noticed for a stationary source and moving observer. For example, if you ride a train past a stationary warning bell, you will hear the bell’s frequency shift from high to low as you pass by. The actual change in frequency due to relative motion of source and observer is called a Doppler shift    . The Doppler effect and Doppler shift are named for the Austrian physicist and mathematician Christian Johann Doppler (1803–1853), who did experiments with both moving sources and moving observers. Doppler, for example, had musicians play on a moving open train car and also play standing next to the train tracks as a train passed by. Their music was observed both on and off the train, and changes in frequency were measured.

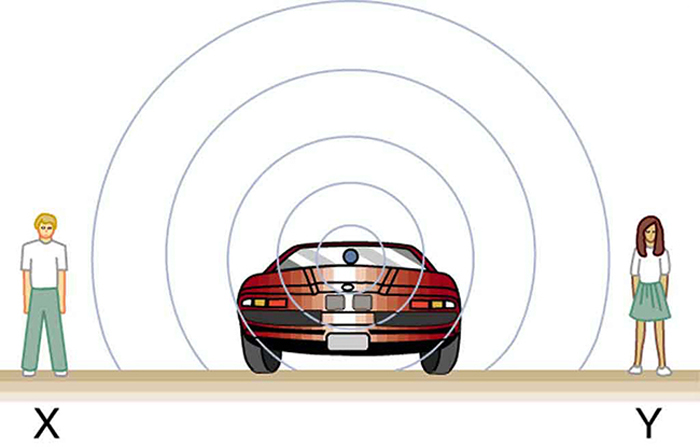
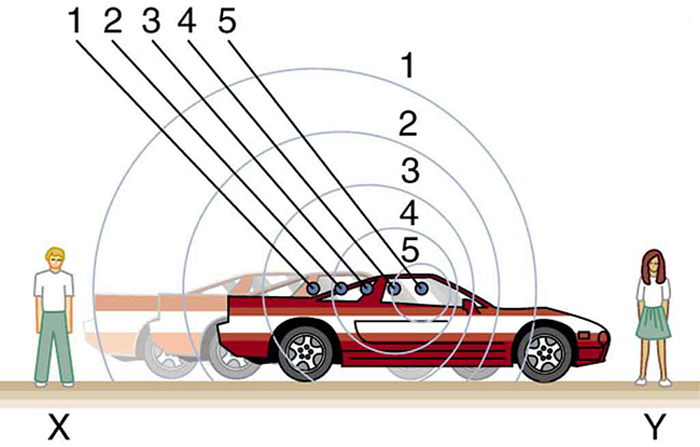
What causes the Doppler shift? [link] , [link] , and [link] compare sound waves emitted by stationary and moving sources in a stationary air mass. Each disturbance spreads out spherically from the point where the sound was emitted. If the source is stationary, then all of the spheres representing the air compressions in the sound wave centered on the same point, and the stationary observers on either side see the same wavelength and frequency as emitted by the source, as in [link] . If the source is moving, as in [link] , then the situation is different. Each compression of the air moves out in a sphere from the point where it was emitted, but the point of emission moves. This moving emission point causes the air compressions to be closer together on one side and farther apart on the other. Thus, the wavelength is shorter in the direction the source is moving (on the right in [link] ), and longer in the opposite direction (on the left in [link] ). Finally, if the observers move, as in [link] , the frequency at which they receive the compressions changes. The observer moving toward the source receives them at a higher frequency, and the person moving away from the source receives them at a lower frequency.

Sound waves coming out of a car stopped on a road are shown as spherical areas of compression. The waves are shown to reach two observers, X and Y, standing on opposite sides of the car.
Sounds emitted by a source spread out in spherical waves. Because the source, observers, and air are stationary, the wavelength and frequency are the same in all directions and to all observers.
Two observers X and Y are standing at two ends of a road. A car is shown to move from observer X on the left toward observer Y on the right. The sound waves are shown as spherical air compressions spreading out from points from which they are emitted marked from one through five. The air compressions are shown to arrive more frequently for the observer Y toward whom the car moves, compared to the compressions reaching X.
Sounds emitted by a source moving to the right spread out from the points at which they were emitted. The wavelength is reduced and, consequently, the frequency is increased in the direction of motion, so that the observer on the right hears a higher-pitch sound. The opposite is true for the observer on the left, where the wavelength is increased and the frequency is reduced.

Questions & Answers

how do you get the 2/50
Abba Reply
number of sport play by 50 student construct discrete data
Aminu Reply
width of the frangebany leaves on how to write a introduction
Theresa Reply
Solve the mean of variance
Veronica Reply
Step 1: Find the mean. To find the mean, add up all the scores, then divide them by the number of scores. ... Step 2: Find each score's deviation from the mean. ... Step 3: Square each deviation from the mean. ... Step 4: Find the sum of squares. ... Step 5: Divide the sum of squares by n – 1 or N.
kenneth
what is error
Yakuba Reply
Is mistake done to something
Vutshila
Hy
anas
hy
What is the life teble
anas
hy
Jibrin
statistics is the analyzing of data
Tajudeen Reply
what is statics?
Zelalem Reply
how do you calculate mean
Gloria Reply
diveving the sum if all values
Shaynaynay
let A1,A2 and A3 events be independent,show that (A1)^c, (A2)^c and (A3)^c are independent?
Fisaye Reply
what is statistics
Akhisani Reply
data collected all over the world
Shaynaynay
construct a less than and more than table
Imad Reply
The sample of 16 students is taken. The average age in the sample was 22 years with astandard deviation of 6 years. Construct a 95% confidence interval for the age of the population.
Aschalew Reply
Bhartdarshan' is an internet-based travel agency wherein customer can see videos of the cities they plant to visit. The number of hits daily is a normally distributed random variable with a mean of 10,000 and a standard deviation of 2,400 a. what is the probability of getting more than 12,000 hits? b. what is the probability of getting fewer than 9,000 hits?
Akshay Reply
Bhartdarshan'is an internet-based travel agency wherein customer can see videos of the cities they plan to visit. The number of hits daily is a normally distributed random variable with a mean of 10,000 and a standard deviation of 2,400. a. What is the probability of getting more than 12,000 hits
Akshay
1
Bright
Sorry i want to learn more about this question
Bright
Someone help
Bright
a= 0.20233 b=0.3384
Sufiyan
a
Shaynaynay
How do I interpret level of significance?
Mohd Reply
It depends on your business problem or in Machine Learning you could use ROC- AUC cruve to decide the threshold value
Shivam
how skewness and kurtosis are used in statistics
Owen Reply
yes what is it
Taneeya
Got questions? Join the online conversation and get instant answers!
Jobilize.com Reply
Practice Key Terms 4

Get Jobilize Job Search Mobile App in your pocket Now!

Get it on Google Play Download on the App Store Now


Source:  OpenStax, College physics. OpenStax CNX. Jul 27, 2015 Download for free at http://legacy.cnx.org/content/col11406/1.9
Google Play and the Google Play logo are trademarks of Google Inc.

Notification Switch

Would you like to follow the 'College physics' conversation and receive update notifications?

Ask