

| << Chapter < Page | Chapter >> Page > |

There is yet another way of expressing the second law of thermodynamics. This version relates to a concept called entropy . By examining it, we shall see that the directions associated with the second law—heat transfer from hot to cold, for example—are related to the tendency in nature for systems to become disordered and for less energy to be available for use as work. The entropy of a system can in fact be shown to be a measure of its disorder and of the unavailability of energy to do work.
Recall that the simple definition of energy is the ability to do work. Entropy is a measure of how much energy is not available to do work. Although all forms of energy are interconvertible, and all can be used to do work, it is not always possible, even in principle, to convert the entire available energy into work. That unavailable energy is of interest in thermodynamics, because the field of thermodynamics arose from efforts to convert heat to work.
We can see how entropy is defined by recalling our discussion of the Carnot engine. We noted that for a Carnot cycle, and hence for any reversible processes, . Rearranging terms yields
for any reversible process. and are absolute values of the heat transfer at temperatures and , respectively. This ratio of is defined to be the change in entropy for a reversible process,
where is the heat transfer, which is positive for heat transfer into and negative for heat transfer out of, and is the absolute temperature at which the reversible process takes place. The SI unit for entropy is joules per kelvin (J/K). If temperature changes during the process, then it is usually a good approximation (for small changes in temperature) to take to be the average temperature, avoiding the need to use integral calculus to find .
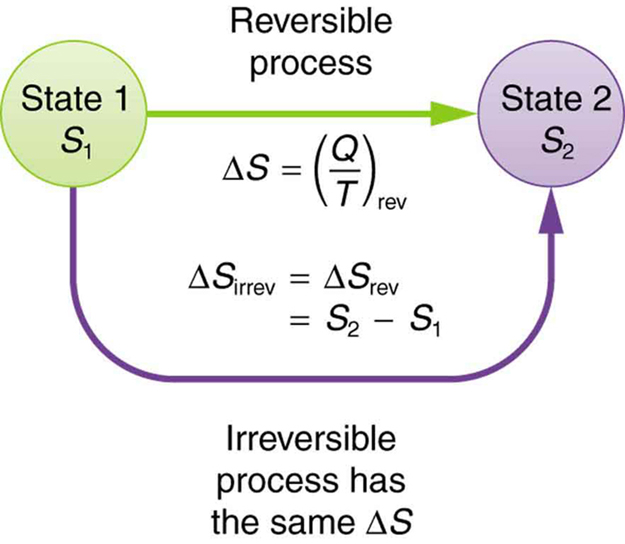
The definition of is strictly valid only for reversible processes, such as used in a Carnot engine. However, we can find precisely even for real, irreversible processes. The reason is that the entropy of a system, like internal energy , depends only on the state of the system and not how it reached that condition. Entropy is a property of state. Thus the change in entropy of a system between state 1 and state 2 is the same no matter how the change occurs. We just need to find or imagine a reversible process that takes us from state 1 to state 2 and calculate for that process. That will be the change in entropy for any process going from state 1 to state 2. (See [link] .)
Notification Switch
Would you like to follow the 'College physics' conversation and receive update notifications?

|
|

|
|

|
|

|
|

|
|

|
|

|
|

|
|

|
|
|
|
|

|