

| << Chapter < Page | Chapter >> Page > |
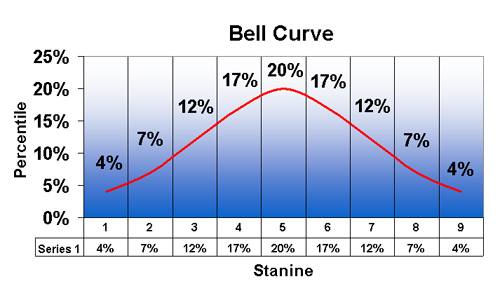
| Stanine | 1 | 2 | 3 | 4 | 5 | 6 | 7 | 8 | 9 |
| Percentage in each stanine band | 4% | 7% | 12% | 17% | 20% | 17% | 12% | 7% | 4% |
Mary is a sixth grader. She received a stanine score of zero on her standardized test in mathematics. This means that Mary's score was very low com pared to other sixth graders. Is that correct?
No. Stanine scores are numbers from I to 9. There is no such thing as a stanine score of zero. A zero score reported as a stanine indicates that an error has been made.
Bill received a stanine score of 5 on the same standardized mathematics test that Mary took. He is also in the sixth grade. The score of 5 means that Bill is doing average work in mathematics, and he would be at the 50th percentile for sixth graders. Is that correct?
Yes and no. Stanine 5 is in the middle of the scale, and in that sense Bill got an average score on the test. However, each stanine represents a band of scores, not a specific score. The 5th stanine extends from the 40th to the 60th percentile. So Bill might be performing as low as the 40th percentile or as high as the 60th percentile but still receive a stanine of 5. However, because the stanine scale reflects a normal curve, the 40th percentile is usually only a few raw score points lower than the 60th percentile.
Pedro received a stanine score of 6.5 on the mathematics test. This score should be inter preted as being midway between the sixth and seventh stanines.
No. Stanines are represented by the single digit whole numbers, such as I, 2, and 3, never by numbers with decimal points. Except for the first and ninth sta nines, each stanine represents a narrow band of scores on the test. (The first andninth stanines may be very wide in terms of raw score points. Each extends to the beginning or end of the test, however far that may be.) Thus, a stanine of 6.5 does not exist. Anyone who uses such a number for a stanine has made an error.
Notification Switch
Would you like to follow the 'Understanding standardised assessment' conversation and receive update notifications?

|
|

|
|

|
|

|
|

|
|

|
|
|
|
|

|
|
|
|
|

|