<< Chapter < Page Chapter >> Page >
This module is part of the collection, A First Course in Electrical and Computer Engineering . The LaTeX source files for this collection were created using an optical character recognition technology, and because of this process there may be more errors than usual. Please contact us if you discover any errors.

In "Complex Numbers" , you learn that complex variables can be represented as points in the plane. MATLAB makes it easy for you to plot complex variables in a graph. Type. The graph window should be activated and the pointdisplayed by a 'o'. You must specify the symbol for display, and the authorized symbols for point display areand. When you are displaying a curve (to come later), no type is necessary. MATLAB automatically adjusts the scale on a graph to accommodate the value of the point being plotted. In this case, the range is [ 0 , 2 ] for the real part and [ 0 , 1 ] for the imaginary part. '*'

Let's now plot a second complex number by typing. Note that the secondcommand erases the firstand changes the scaling to [ 0 , 4 ] and [ 0 , 3 ] . Sometimes you may want to have the points plotted on the same graph. To achieve this, you have to use the command hold on after the first plot. Try the following: plot

The advantage in using thecommand is that there is no limit to the number of plot commands you can type before the hold is turned off, and these plots may involve the same variable plotted over a range of values. You can also use different point displays. A disadvantage of thecommand is that the scaling is enforced by the first plot and is not adjusted for subsequent plots. This is why we plot the pointfirst. Try reversing the order of the plots and see what happens. This means that points outside the scaling will not be displayed. The commandpermits erasing the current graph for the nextcommand. plot

You can freeze the scaling of the graph by using the command. MATLAB gives you the message axis

This freezes the current axis scaling for subsequent plots. Similarly, if you type axis a second time, MATLAB resumes the automatic scaling feature and prints the message

The axis scaling can also be manually enforced by using the command

whereis the lower left corner andis the upper right corner of the graph. This scaling remains in effect until the nextcommand is entered (with or without arguments). axis

Another way to plot several complex numbers on the same graph is to display them as a curve. For this purpose, you have to store the numbersin a vector. For example, type. Note that the two points are at the two extremes of the line plotted on the graph. Ifyou specify a symbol, then no line is drawn, just the extreme points. Try. plot(z,'o')

If you examine your current graph carefully, you will notice that the unit lengths on the x and y axes are not quite the same. In fact, MATLAB adjusts the length of an axis to conform to the overall size of the graph window.What this means is that a 45 o line will actually be displayed at an angle depending on the overall aspect ratio of the graph window. To ensure thatthe aspect ratio is equal to 1, you may enter the command. MATLAB will then enforce an aspect ratio equal to 1, regardless of the aspectratio for the outside graph window. This ensures that circles appear as circles and not as ellipses. MATLAB will make the square graph as large as possibleto fit within the graph window. To go back to the default ratio, just type in. axis('normal')

To add labels to your graph, the functions,, andare useful and self-explanatory. The argumentcontains a string of characters. Add the labelon the horizontal axis and the labelon the vertical axis of your graph. The commanddraws a grid on your graph. The grid does not remain in effect for the next plots. Try it. grid

The plot Instruction. The plot instruction in MATLAB is very versatile. It can be used to plot several different types of data. Its syntax isor. The instruction will plot a vector of data versus another vector of data. The firstvector is referenced to the horizontal axis and the second to the vertical axis. If only one vector is used, then it is plotted with reference to the verticalaxis while the horizontal axis is automatically forced to be the index of the vector for the corresponding data point. The notation inside the apostrophesis optionally used to designate whether each element of the vector is to be plotted as a single point with a certain symbol or as a curve with a straightline drawn between each data value. The colors can also be specified. Possible symbols are, and colors are(red, green, blue, and white). Complex valued vectors are plotted by making the horizontal axis thereal part of the vector and the vertical axis the imaginary part. Warning: A complex valued vector will automatically be plotted correctly on the complexplane (instead of real versus imaginary) only if every element of the vector is complex valued. Try,,,and,to clarify your understanding of plot. Use x = [ 1357 ] , y = [ 2468 ] , z = [ 1 + j , 2 + 2 j , 3 + 3 j ] . plot (Real (z), Imag (z),'*')

We may summarize as follows:

plot(x,'*r') (red star—points with the values ofon vertical and indicies on horizontal) x
plot(y) (line—connected curve of the value ofon vertical and the value ofon horizontal) x
plot(x,y,'og') (line—connected curve of the value ofon vertical and the value ofon horizontal) x
plot(x,y,'og') (circle—points of the value ofon vertical and the value ofon horizontal) x
plot(real(z),imag(z)) (line—connectedplot ofon the complex plane) z
plot(real(z),imag(z),'+b') (blue plus—points ofon the complex plane). z
There are three squares arranged vertically in this image. The first square is subdived into four equal squares with a number present in each square. From left to right the numbers read 1, 2, and then on the lower row, 3 and 4. Number 3 is contained within a smaller box with in the subdivided box. To the left of this box is the phrase subplot(223). The box directly below this one is subdivided in to two vertical rectangles. The upper rectangle contains the number 1 and the lower rectangle contains a small square with the number 2 contained within that square. To the left of this row is the phrase subplot(212). The lowest square is subdivided into two horizontal rectangles. The left rectangle contains a small square with the number 1 contained within this square. The right rectangle contains the number 2. To the left of this square this is the phrase subplot(121). There are three squares arranged vertically in this image. The first square is subdived into four equal squares with a number present in each square. From left to right the numbers read 1, 2, and then on the lower row, 3 and 4. Number 3 is contained within a smaller box with in the subdivided box. To the left of this box is the phrase subplot(223). The box directly below this one is subdivided in to two vertical rectangles. The upper rectangle contains the number 1 and the lower rectangle contains a small square with the number 2 contained within that square. To the left of this row is the phrase subplot(212). The lowest square is subdivided into two horizontal rectangles. The left rectangle contains a small square with the number 1 contained within this square. The right rectangle contains the number 2. To the left of this square this is the phrase subplot(121).

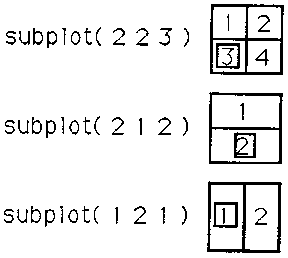
Subplots. It is possible to split the graphics screen up into several separate smaller graphs rather than just one large graph. As many as foursubplots can be created. The MATLAB instructionsignifies which of the smaller graphs is to be accessed with the next plot statement.The mnp argument consists of three digits. Theandare the numbers of rows () and columns () into which the screen should be divided. Thedesignates which of the matrix elements is to be used. For example, p

Help and Demos. MATLAB has on-line help and a collection of demonstrations. For a list of available functions, type

For help on a specific function,for example, type sin

To learn how to use colon (;, a very important and versatile character) in MATLAB, type

The demos will also help you become more familiar with MATLAB and its capabilities. To run them, type

Questions & Answers

differentiate between demand and supply giving examples
Lambiv Reply
differentiated between demand and supply using examples
Lambiv
what is labour ?
Lambiv
how will I do?
Venny Reply
how is the graph works?I don't fully understand
Rezat Reply
information
Eliyee
devaluation
Eliyee
t
WARKISA
hi guys good evening to all
Lambiv
multiple choice question
Aster Reply
appreciation
Eliyee
explain perfect market
Lindiwe Reply
In economics, a perfect market refers to a theoretical construct where all participants have perfect information, goods are homogenous, there are no barriers to entry or exit, and prices are determined solely by supply and demand. It's an idealized model used for analysis,
Ezea
What is ceteris paribus?
Shukri Reply
other things being equal
AI-Robot
When MP₁ becomes negative, TP start to decline. Extuples Suppose that the short-run production function of certain cut-flower firm is given by: Q=4KL-0.6K2 - 0.112 • Where is quantity of cut flower produced, I is labour input and K is fixed capital input (K-5). Determine the average product of lab
Kelo
Extuples Suppose that the short-run production function of certain cut-flower firm is given by: Q=4KL-0.6K2 - 0.112 • Where is quantity of cut flower produced, I is labour input and K is fixed capital input (K-5). Determine the average product of labour (APL) and marginal product of labour (MPL)
Kelo
yes,thank you
Shukri
Can I ask you other question?
Shukri
what is monopoly mean?
Habtamu Reply
What is different between quantity demand and demand?
Shukri Reply
Quantity demanded refers to the specific amount of a good or service that consumers are willing and able to purchase at a give price and within a specific time period. Demand, on the other hand, is a broader concept that encompasses the entire relationship between price and quantity demanded
Ezea
ok
Shukri
how do you save a country economic situation when it's falling apart
Lilia Reply
what is the difference between economic growth and development
Fiker Reply
Economic growth as an increase in the production and consumption of goods and services within an economy.but Economic development as a broader concept that encompasses not only economic growth but also social & human well being.
Shukri
production function means
Jabir
What do you think is more important to focus on when considering inequality ?
Abdisa Reply
any question about economics?
Awais Reply
sir...I just want to ask one question... Define the term contract curve? if you are free please help me to find this answer 🙏
Asui
it is a curve that we get after connecting the pareto optimal combinations of two consumers after their mutually beneficial trade offs
Awais
thank you so much 👍 sir
Asui
In economics, the contract curve refers to the set of points in an Edgeworth box diagram where both parties involved in a trade cannot be made better off without making one of them worse off. It represents the Pareto efficient allocations of goods between two individuals or entities, where neither p
Cornelius
In economics, the contract curve refers to the set of points in an Edgeworth box diagram where both parties involved in a trade cannot be made better off without making one of them worse off. It represents the Pareto efficient allocations of goods between two individuals or entities,
Cornelius
Suppose a consumer consuming two commodities X and Y has The following utility function u=X0.4 Y0.6. If the price of the X and Y are 2 and 3 respectively and income Constraint is birr 50. A,Calculate quantities of x and y which maximize utility. B,Calculate value of Lagrange multiplier. C,Calculate quantities of X and Y consumed with a given price. D,alculate optimum level of output .
Feyisa Reply
Answer
Feyisa
c
Jabir
the market for lemon has 10 potential consumers, each having an individual demand curve p=101-10Qi, where p is price in dollar's per cup and Qi is the number of cups demanded per week by the i th consumer.Find the market demand curve using algebra. Draw an individual demand curve and the market dema
Gsbwnw Reply
suppose the production function is given by ( L, K)=L¼K¾.assuming capital is fixed find APL and MPL. consider the following short run production function:Q=6L²-0.4L³ a) find the value of L that maximizes output b)find the value of L that maximizes marginal product
Abdureman
types of unemployment
Yomi Reply
What is the difference between perfect competition and monopolistic competition?
Mohammed
Got questions? Join the online conversation and get instant answers!
Jobilize.com Reply

Get Jobilize Job Search Mobile App in your pocket Now!

Get it on Google Play Download on the App Store Now


Source:  OpenStax, A first course in electrical and computer engineering. OpenStax CNX. Sep 14, 2009 Download for free at http://cnx.org/content/col10685/1.2
Google Play and the Google Play logo are trademarks of Google Inc.

Notification Switch

Would you like to follow the 'A first course in electrical and computer engineering' conversation and receive update notifications?

Ask