

| << Chapter < Page | Chapter >> Page > |
The Ice Chalet offers dozens of different beginning ice-skating classes. All of the class names are put into a bucket. The 5 P.M., Monday night, ages 8 - 12, beginning ice-skating class was picked. In that class were 64 girls and 16 boys. Suppose that we are interested in the true proportion of girls, ages 8 - 12, in all beginning ice-skating classes at the Ice Chalet. Assume that the children in the selected class is a random sample of the population.
What is being counted?
In words, define the Random Variable .
The number of girls, age 8-12, in the beginning ice skating class
Calculate the following:
State the estimated distribution of . ~
Define a new Random Variable . What is estimating?
In words, define the Random Variable .
The proportion of girls, age 8-12, in the beginning ice skating class.
State the estimated distribution of . ~
Construct a 92% Confidence Interval for the true proportion of girls in the age 8 - 12 beginning ice-skating classes at the Ice Chalet.
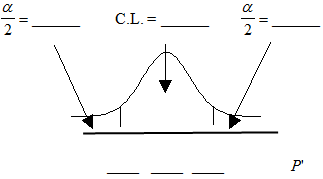
How much area is in both tails (combined)?
1 - 0.92 = 0.08
How much area is in each tail?
0.04
Calculate the following:
The 92% Confidence Interval is:
(0.72; 0.88)
Fill in the blanks on the graph with the areas, upper and lower limits of the confidence interval, and the sample proportion.
In one complete sentence, explain what the interval means.
Using the same and level of confidence, suppose that n were increased to 100. Would the error bound become larger or smaller? How do you know?
Using the same and , how would the error bound change if the confidence level were increased to 98%? Why?
If you decreased the allowable error bound, why would the minimum sample size increase (keeping the same level of confidence)?
Notification Switch
Would you like to follow the 'Elementary statistics' conversation and receive update notifications?

|
|

|
|

|
|
|
|
|

|
|

|
|

|
|

|
|

|
|

|