

| << Chapter < Page | Chapter >> Page > |
A study was conducted to investigate how effective a new diet was in lowering cholesterol. Results for the randomly selected subjects are shown in the table. The differences have a normal distribution. Are the subjects’ cholesterol levels lower on average after the diet? Test at the 5% level.
| Subject | A | B | C | D | E | F | G | H | I |
| Before | 209 | 210 | 205 | 198 | 216 | 217 | 238 | 240 | 222 |
| After | 199 | 207 | 189 | 209 | 217 | 202 | 211 | 223 | 201 |
The p -value is 0.0130, so we can reject the null hypothesis. There is enough evidence to suggest that the diet lowers cholesterol.
A college football coach was interested in whether the college's strength development class increased his players' maximum lift (in pounds) on the bench press exercise. He asked four of his players to participate in a study. The amount of weight they could each lift was recorded before they took the strength development class. After completing the class, the amount of weight they could each lift was again measured. The data are as follows:
| Weight (in pounds) | Player 1 | Player 2 | Player 3 | Player 4 |
|---|---|---|---|---|
| Amount of weight lifted prior to the class | 205 | 241 | 338 | 368 |
| Amount of weight lifted after the class | 295 | 252 | 330 | 360 |
The coach wants to know if the strength development class makes his players stronger, on average.
Record the
differences data. Calculate the differences by subtracting the amount of weight lifted prior to the class from the weight lifted after completing the class. The data for the differences are: {90, 11, -8, -8}. Assume the differences have a normal distribution.
Using the differences data, calculate the sample mean and the sample standard deviation.
= 21.3, s d = 46.7
The data given here would indicate that the distribution is actually right-skewed. The difference 90 may be an extreme outlier? It is pulling the sample mean to be 21.3 (positive). The means of the other three data values are actually negative.
Using the difference data, this becomes a test of a single __________ (fill in the blank).
Define the random variable: mean difference in the maximum lift per player.
The distribution for the hypothesis test is t 3 .
H 0 : μ d ≤ 0, H a : μ d >0
Graph:
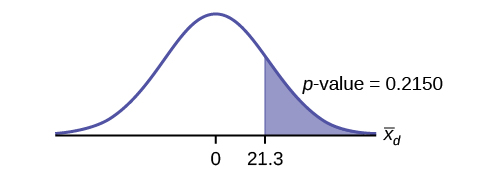
Calculate the p -value: The p -value is 0.2150
Decision: If the level of significance is 5%, the decision is not to reject the null hypothesis, because α< p -value.
What is the conclusion?
At a 5% level of significance, from the sample data, there is not sufficient evidence to conclude that the strength development class helped to make the players stronger, on average.
A new prep class was designed to improve SAT test scores. Five students were selected at random. Their scores on two practice exams were recorded, one before the class and one after. The data recorded in [link] . Are the scores, on average, higher after the class? Test at a 5% level.
| SAT Scores | Student 1 | Student 2 | Student 3 | Student 4 |
|---|---|---|---|---|
| Score before class | 1840 | 1960 | 1920 | 2150 |
| Score after class | 1920 | 2160 | 2200 | 2100 |
The p -value is 0.0874, so we decline to reject the null hypothesis. The data do not support that the class improves SAT scores significantly.
Notification Switch
Would you like to follow the 'Statistics i - math1020 - red river college - version 2015 revision a - draft 2015-10-24' conversation and receive update notifications?

|
|

|
|

|
|

|
|

|
|

|
|

|
|

|
|

|
|

|