

| << Chapter < Page | Chapter >> Page > |
When conducting a hypothesis test that compares two independent population proportions, the following characteristics should be present:
Comparing two proportions, like comparing two means, is common. If two estimated proportions are different, it may be due to a difference in the populations or it may be due to chance. A hypothesis test can help determine if a difference in the estimated proportions reflects a difference in the population proportions.
The difference of two proportions follows an approximate normal distribution. Generally, the null hypothesis states that the two proportions are the same. That is, H 0 : p A = p B . To conduct the test, we use a pooled proportion, p c .
Two types of medication for hives are being tested to determine if there is a difference in the proportions of adult patient reactions. Twenty out of a random sample of 200 adults given medication A still had hives 30 minutes after taking the medication. Twelve out of another random sample of 200 adults given medication B still had hives 30 minutes after taking the medication. Test at a 1% level of significance.
The problem asks for a difference in proportions, making it a test of two proportions.
Let A and B be the subscripts for medication A and medication B, respectively. Then p A and p B are the desired population proportions.
H 0 : p A = p B
p A – p B = 0
H a : p A ≠ p B
p A – p B ≠ 0
The words "is a difference" tell you the test is two-tailed.
Distribution for the test: Since this is a test of two binomial population proportions, the distribution is normal:
P′ A – P′ B follows an approximate normal distribution.
Calculate the p -value using the normal distribution: p -value = 0.1404.
Estimated proportion for group A:
Estimated proportion for group B:
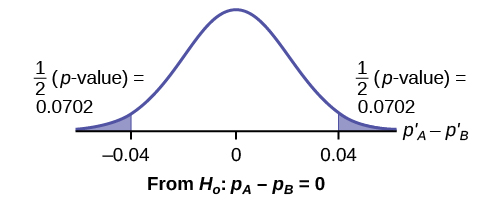
P′ A – P′ B = 0.1 – 0.06 = 0.04.
Half the p -value is below –0.04, and half is above 0.04.
Compare α and the p -value: α = 0.01 and the p -value = 0.1404. α < p -value.
Make a decision: Since α < p -value, do not reject H 0 .
Conclusion: At a 1% level of significance, from the sample data, there is not sufficient evidence to conclude that there is a difference in the proportions of adult patients who did not react after 30 minutes to medication A and medication B .
Notification Switch
Would you like to follow the 'Statistics i - math1020 - red river college - version 2015 revision a - draft 2015-10-24' conversation and receive update notifications?

|
|

|
|

|
|

|
|

|
|

|
|

|
|

|
|

|
|

|