| << Chapter < Page | Chapter >> Page > |
Step-By-Step Example of a Hypothesis Test for a single proportion
Cell Phone Market Research Company conducted a national survey in 2010 and found the 30% of households in the United States owned at least three cell phones. Michele, a statistics student, decided to replicate this study where she lives. She conducts of random survey of 150 households in her town and finds that 53 own at least three cell phones. Is this strong evidence that the proportion of households in Michele’s town that own at least three cell phones is more than the national percentage? Test at a 5% significance level.
| State the question: State what we want to determine and what level of confidence is important in your decision. | We are asked to test the hypothesis that the proportion of households that own at least three cell phones is more than 30%. The parameter of interest, p, is the proportion of households that own at least three cell phones. |
| Plan: Based on the above question(s) and the answer to the following questions, decide which test you will be performing.Is the problem about numerical or categorical data?If the data is numerical is the population standard deviation known?Do you have one group or two groups? |
We have univariate, categorical data. Therefore, we can perform a one proportion z-test to test this belief. Our model will be
|
Hypotheses: State the null and alternative hypotheses in words then in symbolic form
|
Null Hypothesis in words: The null hypothesis is that the true population proportion of households that own at least three cell phones is equal to 30%.
|
| The criteria for the inferential test stated above: Think about the assumptions and check the conditions. |
Randomization Condition: The problem tells us she used a random sample.
|
| Compute the test statistic: |
The conditions are satisfied, so we will use a hypothesis test for a single proportion to test the null hypothesis. For this calculation we need the sample proportion,
|
| Determine the Critical Region(s): Based on your hypotheses are you performing a left-tailed, right tailed or two-tailed test? | I will perform a right tailed test. |
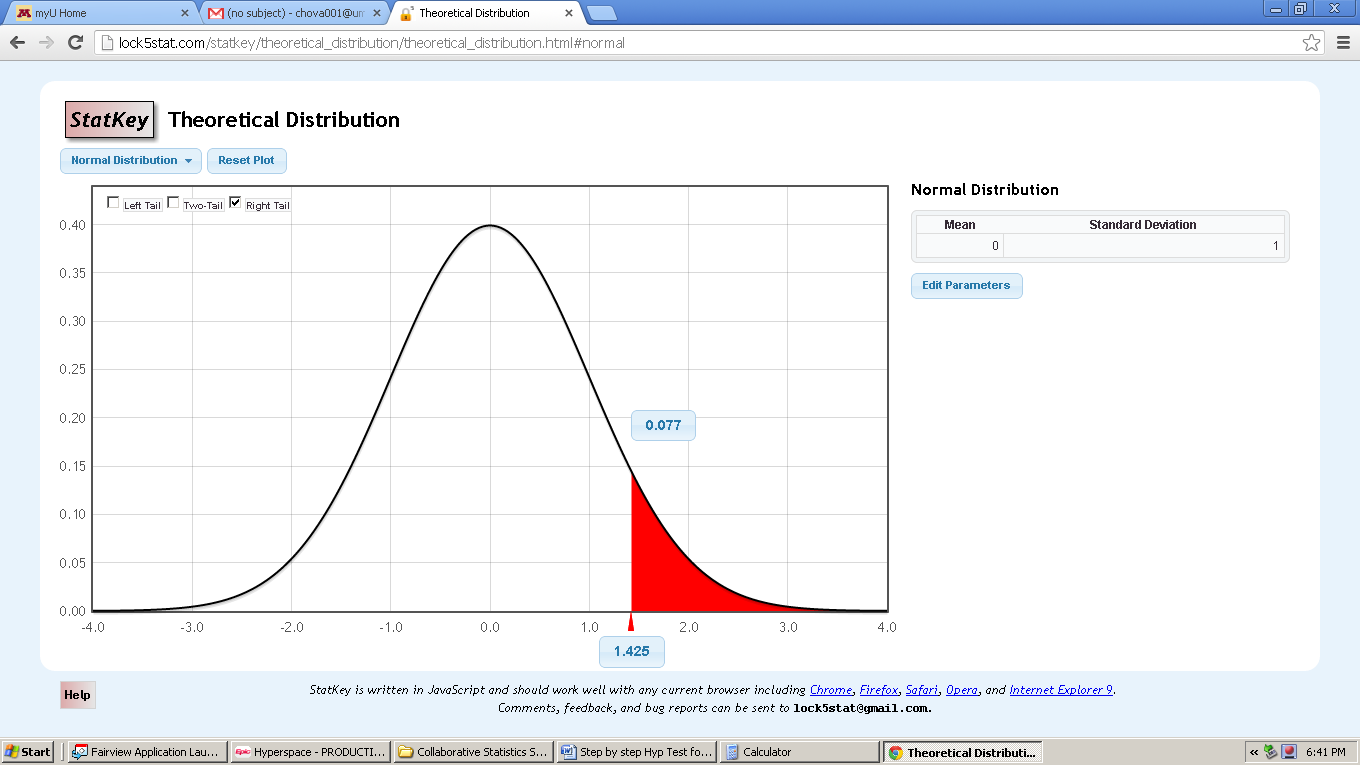
| Sketch the test statistic and critical region: Look up the probability on the table. |
|
|
Determine the P-value |
p-value = P(z>1.425) = 1 – P(z<1.425) =
1 - 0.923 = 0.077 |
|
State whether you reject or fail to reject the Null hypothesis. |
Since the probability is greater than the critical value of 5% we will fail to reject the null hypothesis. |
| Conclusion: Interpret your result in the proper context, and relate it to the original question. | Since the probability is greater than 5%, this is not considered a rare event and the large probability tells us not to reject the null hypothesis. The p-value tells us that there is a 7.7% chance of obtaining our sample percentage of 35.33% if the null hypothesis is true. The sample data do not show sufficient evidence that the percentage of households in Michele city that have at least three cell phones is more than 30%. We do not have strong evidence against the null hypothesis. |
|
If you reject the null hypothesis, continue to complete the following |
NA |
|
Calculate and display your confidence interval for the Alternative hypothesis. |
NA |
|
Conclusion State your conclusion based on your confidence interval. |
NA |
Notification Switch
Would you like to follow the 'Collaborative statistics using spreadsheets' conversation and receive update notifications?

|
|
|
|
|

|
|

|
|

|
|
|
|
|

|
|

|
|
|
|
|

|