

| << Chapter < Page | Chapter >> Page > |
SSPD_Chapter 6_Part 6_ MOS ICs Fabrication Technology
Because of the inherent advantage of MOS ICs, today MOS Technology dominates the IC market as compared to Bipolar Technology. Table 6.10 gives a comparative study of the two technologies.
Table 6.10 Comparative study of Bipolar and MOS Technologies.
| Bipolar Technology | MOS Technology | |
| Carrier participation in transistor action | Both majority and minority carriers partake in transistor action-bipolar | Only majority carriers partake in transistor action-unipolar |
| speed | Traditionally much faster | Slower devices |
| Power dissipation | Higher dissipation | CMOS is nano watt logic under standby condition |
| Packing density | One generation behind because of isolation diffusion | Much higher packing density |
| Design flexibility | Higher design flexibility | |
| Noise Figure | Higher noise figure | Quieter devices. |
| Dynamic range | Input dynamic range is 5mV because it is exponential device. | Input dynamic range is 400mV because it is a quadratic device. |
Semiconductor Industry Association(SIA) brought out the National Technology Roadmap for Semiconductors(NTRS) in 1994, updated in 1997 , again in 1999 and again in 2001. Based on that data we give the following Table 6.11.
Table 6.11. Future Projections for Silicon Technology taken from SIA NTRS (1997).
| Year of the first DRAM shipment | 1997 | 1999 | 2003 | 2006 | 2009 | 2012 |
| Minimum feature size(nm) | 250 | 180 | 130 | 100 | 70 | 50 |
| Memory size(bits/chip) | 256M | 1G | 4G | 16G | 64G | 256G |
| DRAM Chip size(mm 2 ) | 280 | 400 | 560 | 790 | 1120 | 1580 |
| µP transistors/chip | 11M | 21M | 76M | 200M | 520M | 1.4B |
| Maximum wiring levels | 6 | 6-7 | 7 | 7-8 | 8-9 | 9 |
| Minimum mask count | 22 | 22-24 | 24 | 24-26 | 26-28 | 28 |
| Minimum supply voltage | 1.8-2.5 | 1.5-1.8 | 1.2-1.5 | 0.9-1.2 | 0.6-0.9 | 0.5-0.6 |
Table 6.12 Updating of 1997 SIA NTRS Roadmap in 1999 and 2001.
| 2004 | 2005 | 2007 | 2008 | 2010 | 2011 | 2013 | 2014 | 2016 | |
| 1999_NTRS | 100nm | 70nm | 50nm | 35nm | |||||
| 2001_NTRS | 90nm | 65nm | 45nm | 32nm | 22nm |
By a variety of post-lithographic techniques, the physical gate length is shorter than the printed size in photo-resist. It is projected to be 9 nm by 2016. "Lithography half-pitch and transistor gate length scaling trends continue to accelerate. This means that semiconductor chips will continue to get smaller, faster and ultimately less expensive at an even faster rate in the future," noted Paolo Gargini, Chairman of the International Roadmap Committee and Fellow, Intel Corporation "When the 2001 Roadmap looks 15 years into the future, the physical gate length is projected to be a mere 9 nanometers. We are beginning to consider technologies beyond planar or even post-CMOS devices."
In 1970, NMOS IC Technology was introduced but it was replaced by CMOS IC Technology by 1980. So our discussion will concentrate on CMOS Process Flow.
Section 6.6.1. NMOS IC in 1970s.
For academic reasons, we introduce the cross-section view of NMOS IC in Figure 6.39. This was prevalent in 1970s. This includes both enhancement type NMOS and depletion type NMOS.
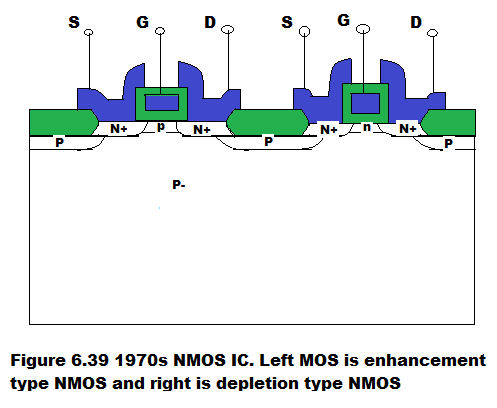
In Figure 6.39, blue colour represents METAL CONTACT and green colour represents OXIDE. Thin oxide is gate oxide and thick oxide is field oxide.
Notification Switch
Would you like to follow the 'Solid state physics and devices-the harbinger of third wave of civilization' conversation and receive update notifications?

|
|

|
|
|
|
|

|
|
|
|
|

|
|

|
|

|
|

|
|
|
|