<< Chapter < Page Chapter >> Page >
  • In a hypothesis test problem, you may see words such as "the level of significance is 1%." The "1%" is the preconceived or preset α .
  • The statistician setting up the hypothesis test selects the value of α to use before collecting the sample data.
  • If no level of significance is given, a common standard to use is α = 0.05.
  • When you calculate the p -value and draw the picture, the p -value is the area in the left tail, the right tail, or split evenly between the two tails. For this reason, we call the hypothesis test left, right, or two tailed.
  • The alternative hypothesis , H a , tells you if the test is left, right, or two-tailed. It is the key to conducting the appropriate test.
  • H a never has a symbol that contains an equal sign.
  • Thinking about the meaning of the p -value    : A data analyst (and anyone else) should have more confidence that he made the correct decision to reject the null hypothesis with a smaller p -value (for example, 0.001 as opposed to 0.04) even if using the 0.05 level for alpha. Similarly, for a large p -value such as 0.4, as opposed to a p -value of 0.056 (alpha = 0.05 is less than either number), a data analyst should have more confidence that she made the correct decision in not rejecting the null hypothesis. This makes the data analyst use judgment rather than mindlessly applying rules.

The following examples illustrate a left-, right-, and two-tailed test.

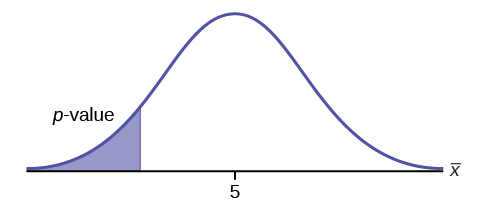
H o : μ = 5, H a : μ <5

Test of a single population mean. H a tells you the test is left-tailed. The picture of the p -value is as follows:

Normal distribution curve of a single population mean with a value of 5 on the x-axis and the p-value points to the area on the left tail of the curve.

Try it

H 0 : μ = 10, H a : μ <10

Assume the p -value is 0.0935. What type of test is this? Draw the picture of the p -value.

left-tailed test

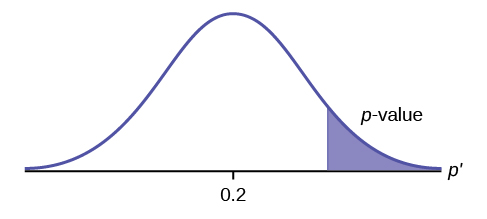
H 0 : p ≤ 0.2   H a : p >0.2

This is a test of a single population proportion. H a tells you the test is right-tailed . The picture of the p -value is as follows:

Normal distribution curve of a single population proportion with the value of 0.2 on the x-axis. The p-value points to the area on the right tail of the curve.

Try it

H 0 : μ ≤ 1, H a : μ >1

Assume the p -value is 0.1243. What type of test is this? Draw the picture of the p -value.

right-tailed test

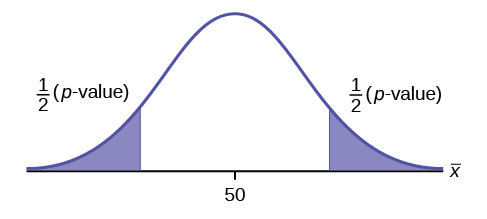
H 0 : p = 50   H a : p ≠ 50

This is a test of a single population mean. H a tells you the test is two-tailed . The picture of the p -value is as follows.

Normal distribution curve of a single population mean with a value of 50 on the x-axis. The p-value formulas, 1/2(p-value), for a two-tailed test is shown for the areas on the left and right tails of the curve.

Try it

H 0 : p = 0.5, H a : p ≠ 0.5

Assume the p -value is 0.2564. What type of test is this? Draw the picture of the p -value.

two-tailed test

Full hypothesis test examples

Jeffrey, as an eight-year old, established a mean time of 16.43 seconds for swimming the 25-yard freestyle, with a standard deviation of 0.8 seconds . His dad, Frank, thought that Jeffrey could swim the 25-yard freestyle faster using goggles. Frank bought Jeffrey a new pair of expensive goggles and timed Jeffrey for 15 25-yard freestyle swims . For the 15 swims, Jeffrey's mean time was 16 seconds. Frank thought that the goggles helped Jeffrey to swim faster than the 16.43 seconds. Conduct a hypothesis test using a preset α = 0.05. Assume that the swim times for the 25-yard freestyle are normal.

Set up the Hypothesis Test:

Since the problem is about a mean, this is a test of a single population mean .

H 0 : μ = 16.43   H a : μ <16.43

For Jeffrey to swim faster, his time will be less than 16.43 seconds. The "<" tells you this is left-tailed.

Determine the distribution needed:

Random variable: X = the mean time to swim the 25-yard freestyle.

Distribution for the test: X is normal (population standard deviation is known: σ = 0.8)

X ¯ ~ N ( μ , σ X n ) Therefore, X ¯ ~ N ( 16.43 , 0.8 15 )

μ = 16.43 comes from H 0 and not the data. σ = 0.8, and n = 15.

Calculate the p -value using the normal distribution for a mean:

p -value = P ( x ¯ <16) = 0.0187 where the sample mean in the problem is given as 16.

p -value = 0.0187 (This is called the actual level of significance .) The p -value is the area to the left of the sample mean is given as 16.

Graph:

Normal distribution curve for the average time to swim the 25-yard freestyle with values 16, as the sample mean, and 16.43 on the x-axis. A vertical upward line extends from 16 on the x-axis to the curve. An arrow points to the left tail of the curve.

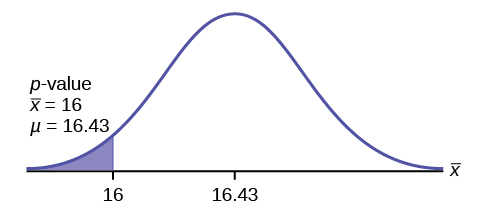
μ = 16.43 comes from H 0 . Our assumption is μ = 16.43.

Interpretation of the p -value: If H 0 is true , there is a 0.0187 probability (1.87%)that Jeffrey's mean time to swim the 25-yard freestyle is 16 seconds or less. Because a 1.87% chance is small, the mean time of 16 seconds or less is unlikely to have happened randomly. It is a rare event.

Compare α and the p -value:

α = 0.05 p -value = 0.0187 α > p -value

Make a decision: Since α > p -value, reject H 0 .

This means that you reject μ = 16.43. In other words, you do not think Jeffrey swims the 25-yard freestyle in 16.43 seconds but faster with the new goggles.

Conclusion: At the 5% significance level, we conclude that Jeffrey swims faster using the new goggles. The sample data show there is sufficient evidence that Jeffrey's mean time to swim the 25-yard freestyle is less than 16.43 seconds.

The p -value can easily be calculated.

When a calculator does a Z -Test, it typically finds the p -value by doing a normal probability calculation using the central limit theorem .

The Type I and Type II errors for this problem are as follows:

The Type I error is to conclude that Jeffrey swims the 25-yard freestyle, on average, in less than 16.43 seconds when, in fact, he actually swims the 25-yard freestyle, onaverage, in 16.43 seconds. (Reject the null hypothesis when the null hypothesis is true.)

The Type II error is that there is not evidence to conclude that Jeffrey swims the 25-yard free-style, on average, in less than 16.43 seconds when, in fact, he actually does swim the 25-yard free-style, on average, in less than 16.43 seconds. (Do not reject the null hypothesis when the null hypothesis is false.)

Questions & Answers

it is the relatively stable flow of income
Chidubem Reply
what is circular flow of income
Divine Reply
branches of macroeconomics
SHEDRACK Reply
what is Flexible exchang rate?
poudel Reply
is gdp a reliable measurement of wealth
Atega Reply
introduction to econometrics
Husseini Reply
Hi
mostafa
hi
LEMLEM
hello
Sammol
hi
Mahesh
bi
Ruqayat
hi
Ruqayat
Hi fellas
Nyawa
hey
Sammol
hi
God
hello
Jahara
Good morning
Jorge
hi
abubakar
hi
Nmesoma
hi
Mahesh
Hi
Tom
Why is unemployment rate never zero at full employment?
Priyanka Reply
bcoz of existence of frictional unemployment in our economy.
Umashankar
what is flexible exchang rate?
poudel
due to existence of the pple with disabilities
Abdulraufu
the demand of a good rises, causing the demand for another good to fall
Rushawn Reply
is it possible to leave every good at the same level
Joseph
I don't think so. because check it, if the demand for chicken increases, people will no longer consume fish like they used to causing a fall in the demand for fish
Anuolu
is not really possible to let the value of a goods to be same at the same time.....
Salome
Suppose the inflation rate is 6%, does it mean that all the goods you purchase will cost 6% more than previous year? Provide with reasoning.
Geetha Reply
Not necessarily. To measure the inflation rate economists normally use an averaged price index of a basket of certain goods. So if you purchase goods included in the basket, you will notice that you pay 6% more, otherwise not necessarily.
Waeth
discus major problems of macroeconomics
Alii Reply
what is the problem of macroeconomics
Yoal
Economic growth Stable prices and low unemployment
Ephraim
explain inflationcause and itis degre
Miresa Reply
what is inflation
Getu
increase in general price levels
WEETO
Good day How do I calculate this question: C= 100+5yd G= 2000 T= 2000 I(planned)=200. Suppose the actual output is 3000. What is the level of planned expenditures at this level of output?
Chisomo Reply
how to calculate actual output?
Chisomo
how to calculate the equilibrium income
Beshir
Criteria for determining money supply
Thapase Reply
who we can define macroeconomics in one line
Muhammad
Aggregate demand
Mohammed
C=k100 +9y and i=k50.calculate the equilibrium level of output
Mercy Reply
Hi
Isiaka
Hi
Geli
hy
Man
👋
Bahunda
hy how are you?
Man
ys
Amisha
how are you guys
Sekou
f9 guys
Amisha
how are you guys
Sekou
ys am also fine
Amisha
fine and you guys
Geli
from Nepal
Amisha
nawalparasi district from belatari
Amisha
nd u
Amisha
I am Camara from Guinea west Africa... happy to meet you guys here
Sekou
ma management ho
Amisha
ahile becheclor ho
Amisha
hjr ktm bta ho ani k kaam grnu hunxa tw
Amisha
belatari
Amisha
1st year ho
Amisha
nd u
Amisha
ahh
Amisha
kaha biratnagar
Amisha
ys
Amisha
kina k vo
Amisha
money as unit of account means what?
Kalombe
A unit of account is something that can be used to value goods and services and make calculations
Jim
all of you please speak in English I can't understand you're language
Muhammad
I want to know how can we define macroeconomics in one line
Muhammad
it must be .9 or 0.9 no Mpc is greater than 1 Y=100+.9Y+50 Y-.9Y=150 0.1Y/0.1=150/0.1 Y=1500
Kalombe
Mercy is it clear?😋
Kalombe
hi can someone help me on this question If a negative shocks shifts the IS curve to the left, what type of policy do you suggest so as to stabilize the level of output? discuss your answer using appropriate graph.
Galge Reply
if interest rate is increased this will will reduce the level of income shifting the curve to the left ◀️
Kalombe
Got questions? Join the online conversation and get instant answers!
Jobilize.com Reply

Get Jobilize Job Search Mobile App in your pocket Now!

Get it on Google Play Download on the App Store Now


Source:  OpenStax, Statistics i - math1020 - red river college - version 2015 revision a - draft 2015-10-24. OpenStax CNX. Oct 24, 2015 Download for free at http://legacy.cnx.org/content/col11891/1.8
Google Play and the Google Play logo are trademarks of Google Inc.

Notification Switch

Would you like to follow the 'Statistics i - math1020 - red river college - version 2015 revision a - draft 2015-10-24' conversation and receive update notifications?

Ask