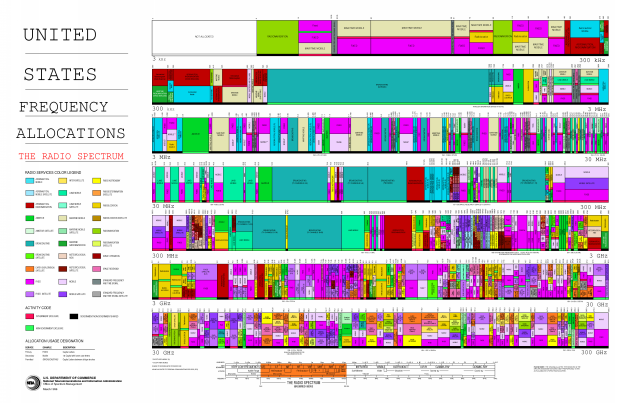
An explanation and picture of the frequency allocation chart.
To prevent radio stations from transmitting signals “on top of
each other,” the United States and other national governmentsin the 1930s began regulating the carrier frequencies and power
outputs stations could use. With increased use of the radiospectrum for both public and private use, this regulation has
become increasingly important. This is the so-called
Frequency Allocation Chart , which shows what kinds
of broadcasting can occur in which frequency bands. Detailedradio carrier frequency assignments are much too detailed to
present here.
Evolution models refer to mathematical and computational representations of the processes involved in biological evolution. These models aim to simulate and understand how species change over time through mechanisms such as natural selection, genetic drift, and mutation. Evolutionary models can be u
faruk
what are the modern trends in religious behaviours
shared standards of acceptable behavior by the group or appropriate behavior in a particular institution or those behaviors that are acceptable in a society
Lucius
that is how i understood it
Lucius
examples of societal norms
Diamond
Discuss the characteristics of the research located within positivist and the interpretivist paradigm