<< Chapter < Page Chapter >> Page >
  • Apply the circulation form of Green’s theorem.
  • Apply the flux form of Green’s theorem.
  • Calculate circulation and flux on more general regions.

In this section, we examine Green’s theorem, which is an extension of the Fundamental Theorem of Calculus to two dimensions. Green’s theorem has two forms: a circulation form and a flux form, both of which require region D in the double integral to be simply connected. However, we will extend Green’s theorem to regions that are not simply connected.

Put simply, Green’s theorem relates a line integral around a simply closed plane curve C and a double integral over the region enclosed by C . The theorem is useful because it allows us to translate difficult line integrals into more simple double integrals, or difficult double integrals into more simple line integrals.

Extending the fundamental theorem of calculus

Recall that the Fundamental Theorem of Calculus says that

a b F ( x ) d x = F ( b ) F ( a ) .

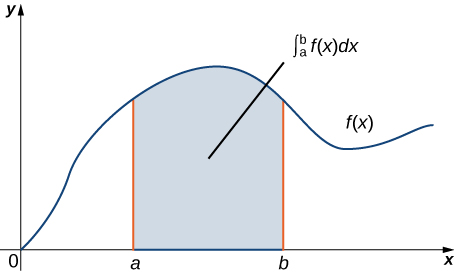
As a geometric statement, this equation says that the integral over the region below the graph of F ( x ) and above the line segment [ a , b ] depends only on the value of F at the endpoints a and b of that segment. Since the numbers a and b are the boundary of the line segment [ a , b ] , the theorem says we can calculate integral a b F ( x ) d x based on information about the boundary of line segment [ a , b ] ( [link] ). The same idea is true of the Fundamental Theorem for Line Integrals:

C f · d r = f ( r ( b ) ) f ( r ( a ) ) .

When we have a potential function (an “antiderivative”), we can calculate the line integral based solely on information about the boundary of curve C .

A graph in quadrant 1 of a generic function f(x). It is an increasing concave up function for the first quarter, an increasing concave down function for the second quarter, a decreasing concave down function for the third quarter, and an increasing concave down function for the last quarter. In the second quarter, a point a is marked on the x axis, and in the third quarter, a point b is marked on the x axis. The area under the curve and between a and b is shaded. This area is labeled the integral from a to b of f(x) dx.
The Fundamental Theorem of Calculus says that the integral over line segment [ a , b ] depends only on the values of the antiderivative at the endpoints of [ a , b ] .

Green’s theorem    takes this idea and extends it to calculating double integrals. Green’s theorem says that we can calculate a double integral over region D based solely on information about the boundary of D . Green’s theorem also says we can calculate a line integral over a simple closed curve C based solely on information about the region that C encloses. In particular, Green’s theorem connects a double integral over region D to a line integral around the boundary of D .

Circulation form of green’s theorem

The first form of Green’s theorem that we examine is the circulation form. This form of the theorem relates the vector line integral over a simple, closed plane curve C to a double integral over the region enclosed by C . Therefore, the circulation of a vector field along a simple closed curve can be transformed into a double integral and vice versa.

Green’s theorem, circulation form

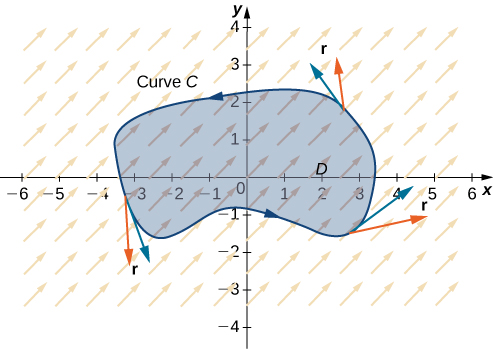
Let D be an open, simply connected region with a boundary curve C that is a piecewise smooth, simple closed curve oriented counterclockwise ( [link] ). Let F = P , Q be a vector field with component functions that have continuous partial derivatives on D . Then,

C F · d r = C P d x + Q d y = D ( Q x P y ) d A .
A vector field in two dimensions with all of the arrows pointing up and to the right. A curve C oriented counterclockwise sections off a region D around the origin. It is a simple, closed region.
The circulation form of Green’s theorem relates a line integral over curve C to a double integral over region D .

Notice that Green’s theorem can be used only for a two-dimensional vector field F . If F is a three-dimensional field, then Green’s theorem does not apply. Since

Questions & Answers

how do you get the 2/50
Abba Reply
number of sport play by 50 student construct discrete data
Aminu Reply
width of the frangebany leaves on how to write a introduction
Theresa Reply
Solve the mean of variance
Veronica Reply
Step 1: Find the mean. To find the mean, add up all the scores, then divide them by the number of scores. ... Step 2: Find each score's deviation from the mean. ... Step 3: Square each deviation from the mean. ... Step 4: Find the sum of squares. ... Step 5: Divide the sum of squares by n – 1 or N.
kenneth
what is error
Yakuba Reply
Is mistake done to something
Vutshila
Hy
anas
hy
What is the life teble
anas
hy
Jibrin
statistics is the analyzing of data
Tajudeen Reply
what is statics?
Zelalem Reply
how do you calculate mean
Gloria Reply
diveving the sum if all values
Shaynaynay
let A1,A2 and A3 events be independent,show that (A1)^c, (A2)^c and (A3)^c are independent?
Fisaye Reply
what is statistics
Akhisani Reply
data collected all over the world
Shaynaynay
construct a less than and more than table
Imad Reply
The sample of 16 students is taken. The average age in the sample was 22 years with astandard deviation of 6 years. Construct a 95% confidence interval for the age of the population.
Aschalew Reply
Bhartdarshan' is an internet-based travel agency wherein customer can see videos of the cities they plant to visit. The number of hits daily is a normally distributed random variable with a mean of 10,000 and a standard deviation of 2,400 a. what is the probability of getting more than 12,000 hits? b. what is the probability of getting fewer than 9,000 hits?
Akshay Reply
Bhartdarshan'is an internet-based travel agency wherein customer can see videos of the cities they plan to visit. The number of hits daily is a normally distributed random variable with a mean of 10,000 and a standard deviation of 2,400. a. What is the probability of getting more than 12,000 hits
Akshay
1
Bright
Sorry i want to learn more about this question
Bright
Someone help
Bright
a= 0.20233 b=0.3384
Sufiyan
a
Shaynaynay
How do I interpret level of significance?
Mohd Reply
It depends on your business problem or in Machine Learning you could use ROC- AUC cruve to decide the threshold value
Shivam
how skewness and kurtosis are used in statistics
Owen Reply
yes what is it
Taneeya
Got questions? Join the online conversation and get instant answers!
Jobilize.com Reply
Practice Key Terms 2

Get Jobilize Job Search Mobile App in your pocket Now!

Get it on Google Play Download on the App Store Now


Source:  OpenStax, Calculus volume 3. OpenStax CNX. Feb 05, 2016 Download for free at http://legacy.cnx.org/content/col11966/1.2
Google Play and the Google Play logo are trademarks of Google Inc.

Notification Switch

Would you like to follow the 'Calculus volume 3' conversation and receive update notifications?

Ask