

| << Chapter < Page | Chapter >> Page > |
The exponential distribution is often concerned with the amount of time until some specific event occurs. For example, the amount of time (beginning now) until an earthquake occurs has an exponential distribution. Other examples include the length, in minutes, of long distancebusiness telephone calls, and the amount of time, in months, a car battery lasts. It can be shown, too, that the value of the change that you have in your pocket or purse approximately follows anexponential distribution.
Values for an exponential random variable occur in the following way. There are fewer large values and more small values. For example, the amount of money customers spend in one tripto the supermarket follows an exponential distribution. There are more people that spend less money and fewer people that spend large amounts of money.
The exponential distribution is widely used in the field of reliability. Reliability deals with the amount of time a product lasts.
Illustrates the exponential distribution: Let = amount of time (in minutes) a postal clerk spends with his/her customer. The time is known to have anexponential distribution with the average amount of time equal to 4 minutes.
is a continuous random variable since time is measured. It is given that = 4 minutes. To do any calculations, you must know , the decay parameter.
. Therefore,
The standard deviation, , is the same as the mean.
The distribution notation is . Therefore, .
The probability density function is The number = 2.71828182846... It is a number that is used often in mathematics. Scientific calculators have the key " ." If you enter 1 for , the calculator will display the value .
The curve is:
where is at least 0 and = 0.25.
For example,
The graph is as follows:
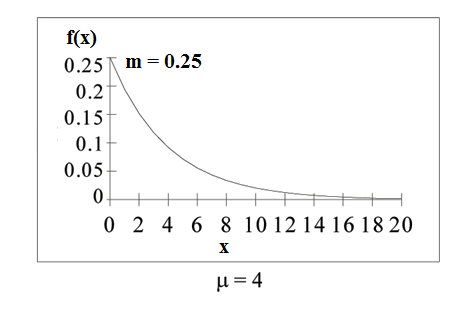
Notice the graph is a declining curve. When = 0,
Find the probability that a clerk spends four to five minutes with a randomly selected customer.
Find .
The cumulative distribution function (CDF) gives the area to the left.
and
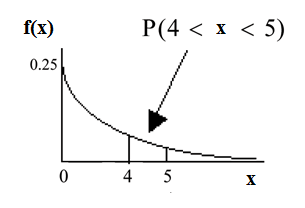
The probability that a postal clerk spends four to five minutes with a randomly selected customer is
Half of all customers are finished within how long? (Find the 50th percentile)
Find the 50th percentile.
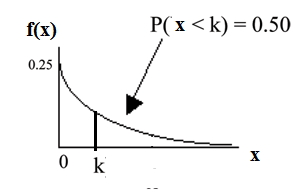
, = 2.8 minutes (calculator or computer)
Half of all customers are finished within 2.8 minutes.
You can also do the calculation as follows:
and
Therefore, and
Take natural logs: . So,
Solve for : minutes
Which is larger, the mean or the median?
Is the mean or median larger?
From part b, the median or 50th percentile is 2.8 minutes. The theoretical mean is 4 minutes. The mean is larger.
Have each class member count the change he/she has in his/her pocket or purse. Your instructor will record the amounts in dollars and cents. Construct a histogram of the data takenby the class. Use 5 intervals. Draw a smooth curve through the bars. The graph should look approximately exponential. Then calculate the mean.
Let = the amount of money a student in your class has in his/her pocket or purse.
The distribution for is approximately exponential with mean, = _______ and = _______. The standard deviation, = ________.
Draw the appropriate exponential graph. You should label the x and y axes, the decay rate, and the mean. Shade the area that represents the probability that one student has less than$.40 in his/her pocket or purse. (Shade ).
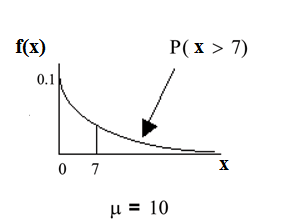
On the average, a certain computer part lasts 10 years. The length of time the computer part lasts is exponentially distributed.
What is the probability that a computer part lasts more than 7 years?
Let = the amount of time (in years) a computer part lasts.
so
Find . Draw a graph.
.
Since then
. The probability that a computer part lasts morethan 7 years is 0.4966.
On the average, how long would 5 computer parts last if they are used one after another?
On the average, 1 computer part lasts 10 years. Therefore, 5 computer parts, if they are used one right after the other would last, on the average,
years.
Eighty percent of computer parts last at most how long?
Find the 80th percentile. Draw a graph. Let = the 80th percentile.
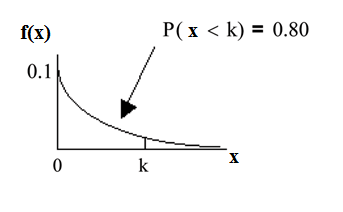
Solve for : years
Eighty percent of the computer parts last at most 16.1 years.
What is the probability that a computer part lasts between 9 and 11 years?
Find . Draw a graph.
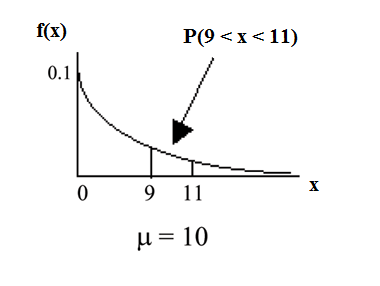
. (calculator or computer)
The probability that a computer part lasts between 9 and 11 years is 0.0737.
Suppose that the length of a phone call, in minutes, is an exponential random variable with decay parameter = . If another person arrives at a public telephone just before you, find the probability that you will have to wait more than 5minutes. Let = the length of a phone call, in minutes.
What is , , and ? The probability that you must wait more than 5 minutes is _______ .
Notification Switch
Would you like to follow the 'Engr 2113 ece math' conversation and receive update notifications?

|
|

|
|

|
|

|
|
|
|
|

|
|

|
|

|
|

|
|

|