

| << Chapter < Page | Chapter >> Page > |
Probabilities are calculated by using technology and the normal distribution table in the appendix of the text.
If the area to the left is 0.0228, then the area to the right is .
The final exam scores in a statistics class were normally distributed with a mean of 63 and a standard deviation of 5.
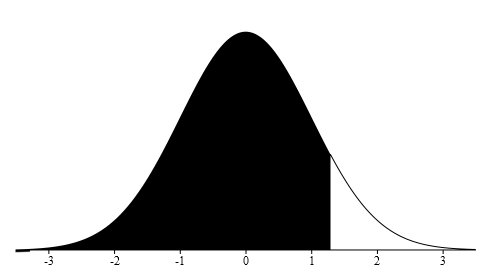
Find the probability that a randomly selected student scored more than 65 on the exam.
Start by defining the variable and describing the population Let a score on the final exam. ~ , where and
Next calculate the z-score,
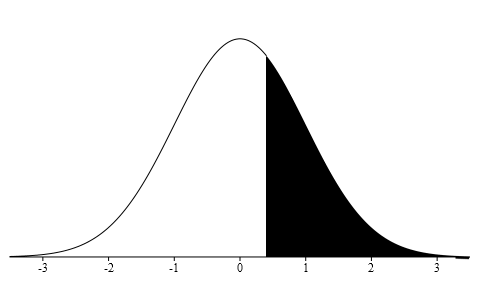
Then draw the normal distribution curve labeling the x-axis with z-scores. Remember that the peak of the distribution will be at zero. Graph where a z-score of +0.40 will be found. We want the probability of being more than this z=score.
.
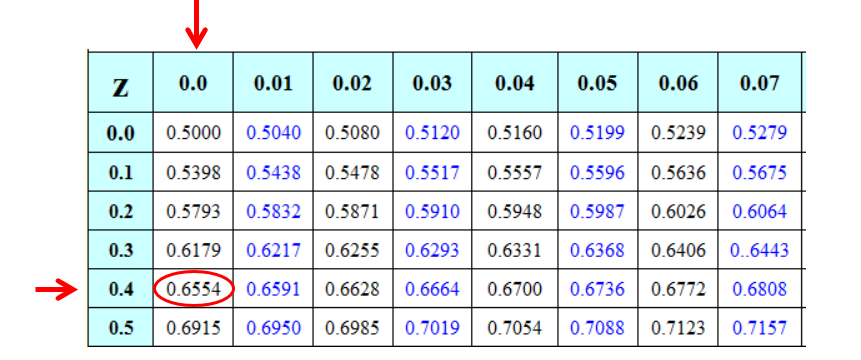
Using the normal distribution table locate the z-score you calculated. The ones and tenths place is found along the side of the table and the hundredths place is located at the top of the table. Our z-score is +0.40 so we will use the positive z-score table and find 0.4 on the side and 0.00 on the top. Our probability is found where this row and column intersect.
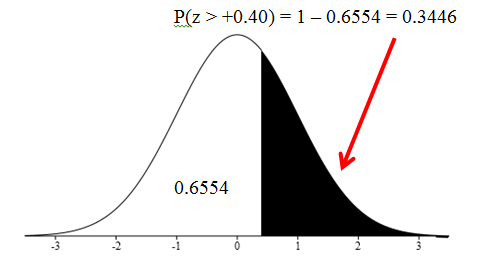
Remember that we are looking for the probability of more than +0.40, P(x>65) = P(z>+0.40). Our table tells us the probability of being less than our z-score so we need to subtract the probability on the chart from one.
Find the probability that a randomly selected student scored less than 76.3.
Using the same population mean and standard deviation in problem 1 , let X = score on the final exam. X~N(63, 5), where µ = 63 and σ = 5.
Next calculate the z-score,
Then draw the normal distribution curve labeling the x-axis with z-scores. Remember that the peak of the distribution will be at zero. Graph where a z-score of +2.66 will be found. We want the probability of being less than this z=score, P(x<76.3) = P(z<+2.66), so we will shade the graph to the left.
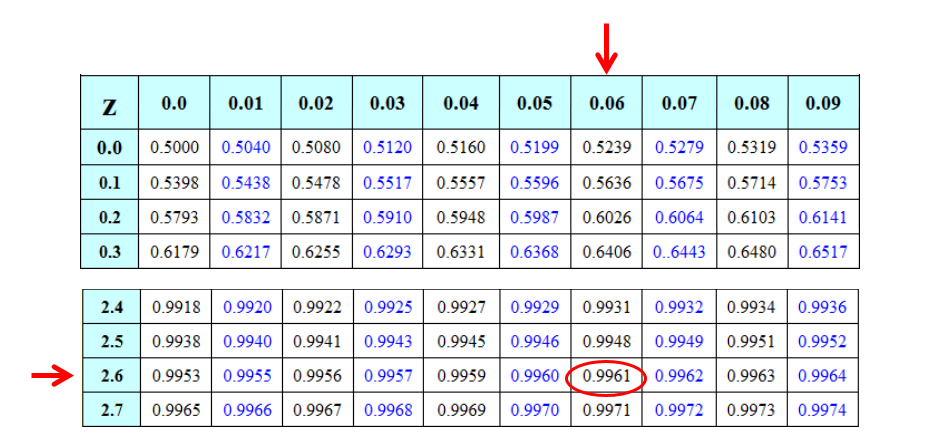
Our table tells us the probability of being less than our z-score the probability we see on the table is the answer to our question; =
The probability that one student scores less than 76.3 is approximately .9961 (or 99.61%).
Find the 90th percentile (that is, find the score k that has 90 % of the scores below k and 10% of the scores above k). We are using the same population as in the previous problems, X~N(63, 5).
Start by using the standard normal table and finding which z-score gives a probability closest to 90% or 0.90. To do this look at the probabilities in the interior of the table, 0.8997 is the closest .090. The z-score for this probability is 1.28.
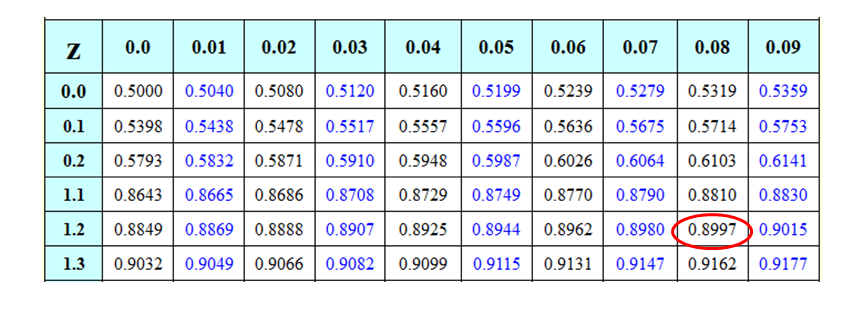
Next draw the graph and shading the area that corresponds to the 90 th percentile.
Find the z-score 1.28 on graph and shade the area to the right. Using your z-score, mean and standard deviation put the values you know into the z-score formula. Use algebra to solve for k, the score closest to 90%
The score closest to 90% is 69.4.
A computer is used for office work at home, research, communication, personal finances, education, entertainment, social networking and a myriad of other things. Suppose that the average number of hours a householdpersonal computer is used for entertainment is 2 hours per day. Assume the times for entertainment are normally distributed and the standard deviation for the times is half an hour.
Find the probability that a household personal computer is used between 1.8 and 2.75 hours per day.
Let = the amount of time (in hours) a household personal computer is used for entertainment. ~ where and .
Find . We want to know the probability of being between 1.8 and 2.75 hours. Start by calculating the z-score for each of these values.To calculate the z-score,
Draw the standard normal distribution curve labeling the x-axis with z-scores. Graph where a z-score of -0.40 and +1.50 will be found. We want the probability of being between these z-scores, P(1.8<x<2.75) = P(-0.40<z<+1.50), so we will shade between these two z-scores.
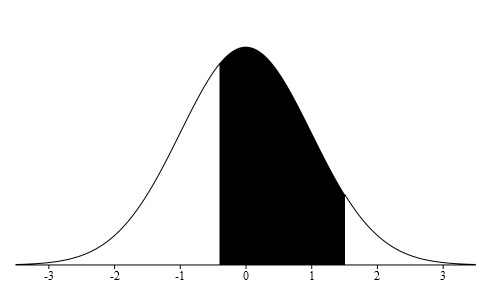
Now look up the two z-scores on the Z-score table to find their probabilities. P(z<-0.40) = 0.3446 and P(z<1.50) = 0.9332. To find the probability of being between two values subtract the two probabilities, the larger probability take away the smaller probability, 0.9332 - 0.3446 = 0.5886.
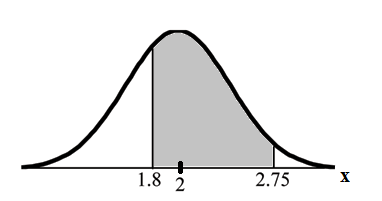
The probability that a household personal computer is used between 1.8 and 2.75 hours per day for entertainment is 0.5886.
Find the maximum number of hours per day that the bottom quartile of households use a personal computer for entertainment.
To find the maximum number of hours per day that the bottom quartile of households uses a personal computer for entertainment, find the 25th percentile, , where .
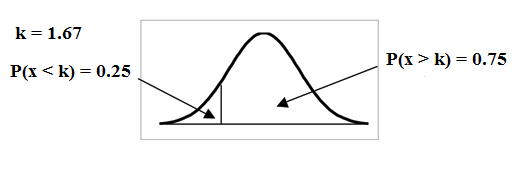
Find the z-score that has a probability closest to 25% or .25. The P(z<-0.67)=0.2514. Using the same population as in the previous problem, X~N(2, 0.5) put what you know into the z-score formula and solve for k. Use algebra to solve for k, the score closest to 25%
The maximum number of hours per day that the bottom quartile of households uses a personal computer for entertainment is 1.66 hours.
Notification Switch
Would you like to follow the 'Collaborative statistics using spreadsheets' conversation and receive update notifications?

|
|

|
|

|
|

|
|

|
|

|
|

|
|

|
|

|
|

|