<< Chapter < Page Chapter >> Page >
Spectrograms visually represent the speach signal, and the calculation of the Spectrogram is briefly explained.

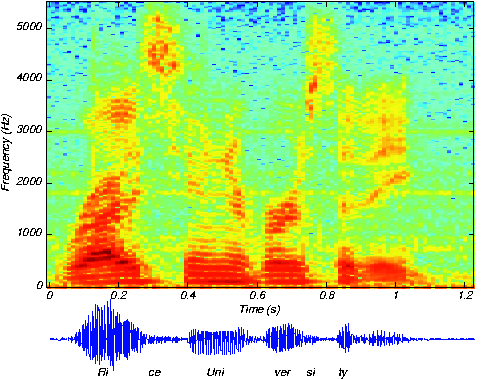
We know how to acquire analog signals for digital processing ( pre-filtering , sampling , and A/D conversion ) and to compute spectra of discrete-time signals (using the FFT algorithm ), let's put these various components together to learn how the spectrogram shown in [link] , which is used to analyze speech , is calculated. The speech was sampled at a rate of 11.025 kHzand passed through a 16-bit A/D converter.

Music compact discs (CDs) encode their signals at a sampling rate of 44.1 kHz. We'll learn the rationale for thisnumber later. The 11.025 kHz sampling rate for the speech is 1/4 of the CD sampling rate, and was the lowest availablesampling rate commensurate with speech signal bandwidths available on my computer.

Looking at [link] the signal lasted a little over 1.2 seconds. How long was thesampled signal (in terms of samples)? What was the datarate during the sampling process in bps (bits per second)?Assuming the computer storage is organized in terms of bytes (8-bit quantities), how many bytes of computer memory doesthe speech consume?

Number of samples equals 1.2 11025 13230 . The datarate is 11025 16 176.4 kbps. The storage required would be 26460 bytes.

Got questions? Get instant answers now!

Speech spectrogram

The resulting discrete-time signal, shown in the bottom of [link] , clearly changes its character with time. To display these spectral changes, thelong signal was sectioned into frames : comparatively short, contiguous groups of samples.Conceptually, a Fourier transform of each frame is calculated using the FFT. Each frame is not so long that significantsignal variations are retained within a frame, but not so short that we lose the signal's spectral character. Roughly speaking, the speech signal's spectrum is evaluated over successive time segments and stacked side by side so that the x -axis corresponds to time and the y -axis frequency, with color indicating the spectral amplitude.

An important detail emerges when we examine each framed signal ( [link] ).

Spectrogram hanning vs. rectangular
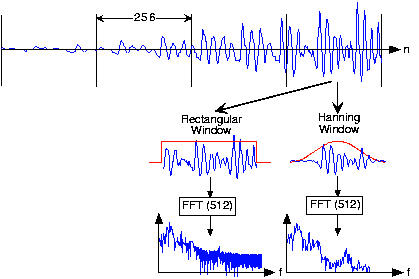
The top waveform is a segment 1024 samples long taken from the beginning of the "Rice University" phrase. Computing [link] involved creating frames, here demarked by the vertical lines, that were 256 sampleslong and finding the spectrum of each. If a rectangular window is applied (corresponding to extracting a frame fromthe signal), oscillations appear in the spectrum (middle of bottom row). Applying a Hanning window gracefully tapers thesignal toward frame edges, thereby yielding a more accurate computation of the signal's spectrum at that moment of time.
At the frame's edges, the signal may change very abruptly, a feature not present in theoriginal signal. A transform of such a segment reveals a curious oscillation in the spectrum, an artifact directlyrelated to this sharp amplitude change. A better way to frame signals for spectrograms is to apply a window : Shape the signal values within a frame so that the signal decaysgracefully as it nears the edges. This shaping is accomplished by multiplying the framed signal by the sequence w n . In sectioning the signal, we essentially applied a rectangular window: w n 1 , 0 n N 1 . A much more graceful window is the Hanning window ; it has the cosine shape w n 1 2 1 2 n N . As shown in [link] , this shaping greatly reduces spurious oscillations in each frame'sspectrum. Considering the spectrum of the Hanning windowed frame, we find that the oscillations resulting from applying therectangular window obscured a formant (the one located at a little more than half the Nyquist frequency).

What might be the source of these oscillations? To gain some insight, what is thelength- 2 N discrete Fourier transform of a length- N pulse? The pulse emulates the rectangular window, and certainly has edges.Compare your answer with the length- 2 N transform of alength- N Hanning window.

The oscillations are due to the boxcar window's Fourier transform, which equals the sinc function.

Got questions? Get instant answers now!

Non-overlapping windows

In comparison with the original speech segment shown in the upper plot, the non-overlapped Hanning windowed version shownbelow it is very ragged. Clearly, spectral information extracted from the bottom plot could well miss importantfeatures present in the original.

If you examine the windowed signal sections in sequence to examine windowing's effect on signal amplitude, we see that wehave managed to amplitude-modulate the signal with the periodically repeated window ( [link] ). To alleviate this problem, frames are overlapped (typically by half a frame duration). This solutionrequires more Fourier transform calculations than needed by rectangular windowing, but the spectra are much better behavedand spectral changes are much better captured.

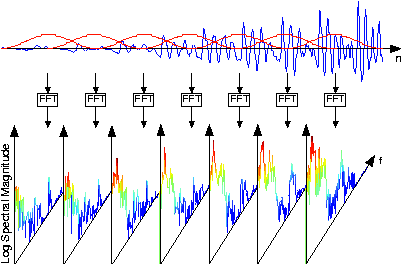
The speech signal, such as shown in the speech spectrogram , is sectioned into overlapping, equal-length frames, with a Hanning window appliedto each frame. The spectra of each of these is calculated, and displayed in spectrograms with frequency extending vertically,window time location running horizontally, and spectral magnitude color-coded. [link] illustrates these computations.
Overlapping windows for computing spectrograms

The original speech segment and the sequence of overlapping Hanning windows applied to it are shown in the upper portion.Frames were 256 samples long and a Hanning window was applied with a half-frame overlap. A length-512 FFT of each frame wascomputed, with the magnitude of the first 257 FFT values displayed vertically, with spectral amplitude valuescolor-coded.

Why the specific values of 256 for N and 512 for K ? Another issue is how was the length-512 transform of each length-256 windowed framecomputed?

These numbers are powers-of-two, and the FFT algorithm can be exploited with these lengths. To compute a longertransform than the input signal's duration, we simply zero-pad the signal.

Got questions? Get instant answers now!

Questions & Answers

what is biology
Hajah Reply
the study of living organisms and their interactions with one another and their environments
AI-Robot
what is biology
Victoria Reply
HOW CAN MAN ORGAN FUNCTION
Alfred Reply
the diagram of the digestive system
Assiatu Reply
allimentary cannel
Ogenrwot
How does twins formed
William Reply
They formed in two ways first when one sperm and one egg are splited by mitosis or two sperm and two eggs join together
Oluwatobi
what is genetics
Josephine Reply
Genetics is the study of heredity
Misack
how does twins formed?
Misack
What is manual
Hassan Reply
discuss biological phenomenon and provide pieces of evidence to show that it was responsible for the formation of eukaryotic organelles
Joseph Reply
what is biology
Yousuf Reply
the study of living organisms and their interactions with one another and their environment.
Wine
discuss the biological phenomenon and provide pieces of evidence to show that it was responsible for the formation of eukaryotic organelles in an essay form
Joseph Reply
what is the blood cells
Shaker Reply
list any five characteristics of the blood cells
Shaker
lack electricity and its more savely than electronic microscope because its naturally by using of light
Abdullahi Reply
advantage of electronic microscope is easily and clearly while disadvantage is dangerous because its electronic. advantage of light microscope is savely and naturally by sun while disadvantage is not easily,means its not sharp and not clear
Abdullahi
cell theory state that every organisms composed of one or more cell,cell is the basic unit of life
Abdullahi
is like gone fail us
DENG
cells is the basic structure and functions of all living things
Ramadan
What is classification
ISCONT Reply
is organisms that are similar into groups called tara
Yamosa
in what situation (s) would be the use of a scanning electron microscope be ideal and why?
Kenna Reply
A scanning electron microscope (SEM) is ideal for situations requiring high-resolution imaging of surfaces. It is commonly used in materials science, biology, and geology to examine the topography and composition of samples at a nanoscale level. SEM is particularly useful for studying fine details,
Hilary
cell is the building block of life.
Condoleezza Reply
Got questions? Join the online conversation and get instant answers!
Jobilize.com Reply

Get Jobilize Job Search Mobile App in your pocket Now!

Get it on Google Play Download on the App Store Now


Source:  OpenStax, Fundamentals of electrical engineering i. OpenStax CNX. Aug 06, 2008 Download for free at http://legacy.cnx.org/content/col10040/1.9
Google Play and the Google Play logo are trademarks of Google Inc.

Notification Switch

Would you like to follow the 'Fundamentals of electrical engineering i' conversation and receive update notifications?

Ask