Discussion of Discrete-time Fourier Transforms. Topics include comparison with analog transforms and discussion of Parseval's theorem.
The Fourier transform of the discrete-time signal
is defined to be
Frequency here has no units. As should be expected, thisdefinition is linear, with the transform of a sum of signals
equaling the sum of their transforms. Real-valued signals haveconjugate-symmetric spectra:
.
A special property of the discrete-time Fourier transform isthat it is periodic with period one:
.
Derive this property from the definition of the DTFT.
Because of this periodicity, we need only plot the spectrum overone period to understand completely the spectrum's structure;
typically, we plot the spectrum over the frequency range
.
When the signal is real-valued, we can further simplify ourplotting chores by showing the spectrum only over
;
the spectrum at negative frequencies can be derived frompositive-frequency spectral values.
When we obtain the discrete-time signal via sampling an analog
signal, the
Nyquist frequency corresponds to the
discrete-time frequency
. To show this, note that a sinusoid having a
frequency equal to the Nyquist frequency
has a sampled waveform that equals
The exponential in the DTFT at frequency
equals
, meaning that discrete-time frequency equals analog
frequency multiplied by the sampling interval
and
represent discrete-time and analog frequency
variables, respectively. The
aliasing figure provides
another way of deriving this result. As the duration of eachpulse in the periodic sampling signal
narrows, the amplitudes of the signal's spectral
repetitions, which are governed by the
Fourier series coefficients of
, become increasingly equal. Examination of the
periodic pulse
signal reveals that as
decreases, the value of
,
the largest Fourier coefficient, decreases to zero:
.
Thus, to maintain a mathematically viable Sampling Theorem, theamplitude
must increase as
, becoming infinitely large as the pulse duration
decreases. Practical systems use a small value of
, say
and use amplifiers to rescale the signal. Thus, the sampledsignal's spectrum becomes periodic with period
.
Thus, the Nyquist frequency
corresponds to the frequency
.
Let's compute the discrete-time Fourier transform of the
exponentially decaying sequence
,
where
is the unit-step sequence. Simply plugging the signal'sexpression into the Fourier transform formula,
This sum is a special case of the
geometric
series .
Thus, as long as
,
we have our Fourier transform.
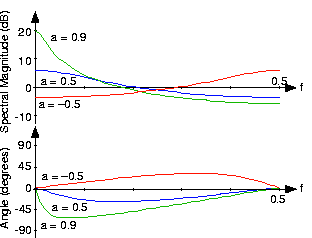
Using Euler's relation, we can express the magnitude and phase
of this spectrum.
No matter what value of
we
choose, the above formulae clearly demonstrate the periodicnature of the spectra of discrete-time signals.
[link] shows indeed that the spectrum
is a periodic function. We need only consider the spectrumbetween
and
to unambiguously define it. When
,
we have a lowpass spectrum—the spectrum diminishes asfrequency increases from 0 to
—with increasing
leading to a greater low frequency
content; for
,
we have a highpass spectrum(
[link] ).
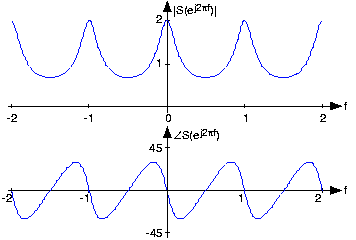
The spectrum of the exponential signal
(
) is shown over
the frequency range [-2, 2], clearly demonstrating the
periodicity of all discrete-time spectra. The angle has unitsof degrees.
Spectra of exponential signals
The spectra of several exponential signals are shown. What is
the apparent relationship between the spectra for
and
?
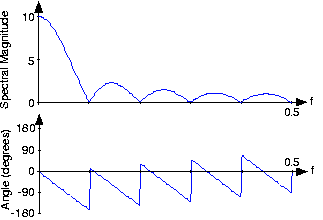
Analogous to the analog pulse signal, let's find the spectrum
of the length-
pulse sequence.
The Fourier transform of this sequence has the form of a
truncated geometric series.
For the so-called finite geometric series, we know that
Derive this formula for the finite geometric series sum.
The "trick" is to consider the difference between theseries' sum and the sum of the series multiplied by
.
which, after manipulation, yields the geometric sum formula.
The ratio of sine functions has the generic form of
,
which is known as the
discrete-time sinc function
.
Thus, our transform can be concisely expressed as
. The discrete-time pulse's spectrum contains many
ripples, the number of which increase with
, the pulse's duration.
Spectrum of length-ten pulse
The spectrum of a length-ten pulse is shown. Can you explain
the rather complicated appearance of the phase?
The inverse discrete-time Fourier transform is easily derived
from the following relationship:
Therefore, we find that
The Fourier transform pairs in discrete-time are
The properties of the discrete-time Fourier transform mirror
those of the analog Fourier transform. The
DTFT properties table shows similarities and differences. One important common
property is Parseval's Theorem.
To show this important property, we simply substitute theFourier transform expression into the frequency-domain
expression for power.
Using the
orthogonality
relation , the integral equals
,
where
is the
unit sample . Thus, the double sum collapses
into a single sum because nonzero values occur only when
,
giving Parseval's Theorem as a result. We term
the energy in the discrete-time signal
in spite of the fact that discrete-time signals don't consume(or produce for that matter) energy. This terminology is a
carry-over from the analog world.
Suppose we obtained our discrete-time signal from values ofthe product
,
where the duration of the component pulses in
is
. How is
the discrete-time signal energy related to the total energycontained in
?
Assume the signal is bandlimited and that the sampling ratewas chosen appropriate to the Sampling Theorem's conditions.
If the sampling frequency exceeds the Nyquist frequency, thespectrum of the samples equals the analog spectrum, but overthe normalized analog frequency
. Thus, the energy in the sampled signal equals
the original signal's energy multiplied by
.
In economics, a perfect market refers to a theoretical construct where all participants have perfect information, goods are homogenous, there are no barriers to entry or exit, and prices are determined solely by supply and demand. It's an idealized model used for analysis,
When MP₁ becomes negative, TP start to decline.
Extuples Suppose that the short-run production function of certain cut-flower firm is given by: Q=4KL-0.6K2 - 0.112 •
Where is quantity of cut flower produced, I is labour input and K is fixed capital input (K-5). Determine the average product of lab
Kelo
Extuples Suppose that the short-run production function of certain cut-flower firm is given by: Q=4KL-0.6K2 - 0.112 •
Where is quantity of cut flower produced, I is labour input and K is fixed capital input (K-5). Determine the average product of labour (APL) and marginal product of labour (MPL)
Quantity demanded refers to the specific amount of a good or service that consumers are willing and able to purchase at a give price and within a specific time period. Demand, on the other hand, is a broader concept that encompasses the entire relationship between price and quantity demanded
Ezea
ok
Shukri
how do you save a country economic situation when it's falling apart
Economic growth as an increase in the production and consumption of goods and services within an economy.but
Economic development as a broader concept that encompasses not only economic growth but also social & human well being.
Shukri
production function means
Jabir
What do you think is more important to focus on when considering inequality ?
sir...I just want to ask one question... Define the term contract curve? if you are free please help me to find this answer 🙏
Asui
it is a curve that we get after connecting the pareto optimal combinations of two consumers after their mutually beneficial trade offs
Awais
thank you so much 👍 sir
Asui
In economics, the contract curve refers to the set of points in an Edgeworth box diagram where both parties involved in a trade cannot be made better off without making one of them worse off. It represents the Pareto efficient allocations of goods between two individuals or entities, where neither p
Cornelius
In economics, the contract curve refers to the set of points in an Edgeworth box diagram where both parties involved in a trade cannot be made better off without making one of them worse off. It represents the Pareto efficient allocations of goods between two individuals or entities,
Cornelius
Suppose a consumer consuming two commodities X and Y has
The following utility function u=X0.4 Y0.6. If the price of the X and Y are 2 and 3 respectively and income Constraint is birr 50.
A,Calculate quantities of x and y which maximize utility.
B,Calculate value of Lagrange multiplier.
C,Calculate quantities of X and Y consumed with a given price.
D,alculate optimum level of output .
the market for lemon has 10 potential consumers, each having an individual demand curve p=101-10Qi, where p is price in dollar's per cup and Qi is the number of cups demanded per week by the i th consumer.Find the market demand curve using algebra. Draw an individual demand curve and the market dema
suppose the production function is given by ( L, K)=L¼K¾.assuming capital is fixed find APL and MPL. consider the following short run production function:Q=6L²-0.4L³ a) find the value of L that maximizes output b)find the value of L that maximizes marginal product