

| << Chapter < Page | Chapter >> Page > |
If is a normally distributed random variable and ~ , then the z-score is:
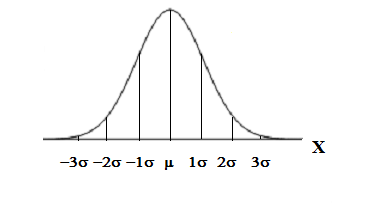
The z-score tells you how many standard deviations that the value is above (to the right of) or below (to the left of) the mean, . Values of that are larger than the mean have positive z-scores and values of that are smaller than the mean have negative z-scores. If equals the mean, then has a z-score of .
Suppose ~ . This says that is a normally distributed random variable with mean and standard deviation . Suppose . Then:
This means that is 2 standard deviations above or to the right of the mean . The standard deviation is .
Notice that:
Now suppose . Then:
This means that is 0.67 standard deviations below or to the left of the mean . Notice that:
is approximately equal to 1 (This has the pattern )
Summarizing, when is positive, is above or to the right of and when is negative, is to the left of or below .
Some doctors believe that a person can lose 5 pounds, on the average, in a month by reducing his/her fat intake and by exercising consistently. Suppose weight loss has anormal distribution. Let = the amount of weight lost (in pounds) by a person in a month. Use a standard deviation of 2 pounds. ~ . Fill in the blanks.
Suppose a person lost 10 pounds in a month. The z-score when pounds is (verify). This z-score tells you that is ________ standard deviations to the ________ (right or left) of the mean _____ (What is the mean?).
This z-score tells you that is 2.5 standard deviations to the right of the mean 5 .
Suppose a person gained 3 pounds (a negative weight loss). Then = __________. This z-score tells you that is ________ standard deviations to the __________ (right or left) of the mean.
= -4 . This z-score tells you that is 4 standard deviations to the left of the mean.
Suppose the random variables and have the following normal distributions: ~ and . If , then . (This was previously shown.) If , what is ?
The z-score for is . This means that 4 is standard deviations to the right of the mean. Therefore, and are both 2 (of their ) standard deviations to the right of their respective means.
The z-score allows us to compare data that are scaled differently. To understand the concept, suppose ~ represents weight gains for one group of people who are trying to gain weight in a 6 week period and ~ measures the same weight gain for a second group of people. A negative weight gain would be a weight loss.Since and are each 2 standard deviations to the right of their means, they represent the same weight gain relative to their means .
Suppose has a normal distribution with mean 50 and standard deviation 6.
Notification Switch
Would you like to follow the 'Collaborative statistics (custom lecture version modified by t. short)' conversation and receive update notifications?

|
|

|
|

|
|

|
|

|
|

|
|

|
|

|
|

|
|

|