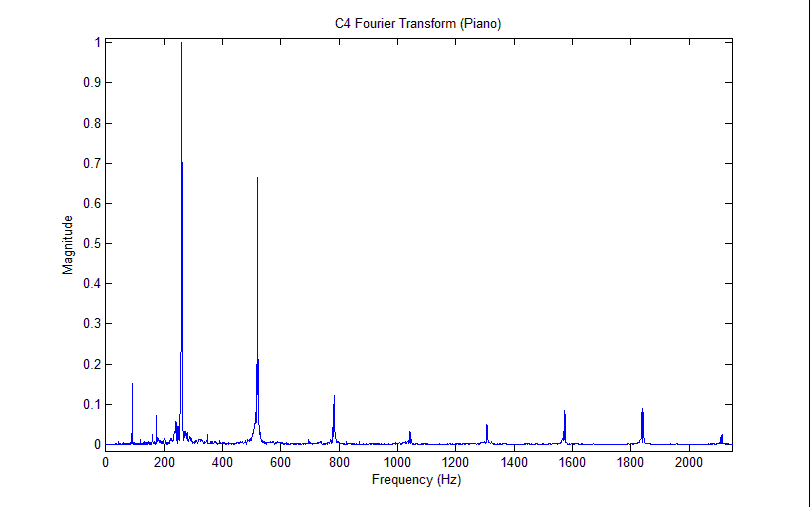
When working with the Fourier transform of musical notes, it's important to remember that each note has its own harmonic frequency. For example, a C4 would have a harmonic frequency of 440 Hz. Ideally, in the spectrum, there would be peak at 440 Hz. While this may serve as a good reference for algorithmic purposes, one also needs to remember that pianos never actually produce perfect notes. The reason is that the reverberation generated by the string of a note as it's played affects the strings around it. Therefore, when you look at a plot of the Fourier transform of a C4, you'll actually peaks at many different frequencies. This issue is especially exasperated with chords.
This is what the fourier transform of a C4 note played on a Grand Piano looks like.
Hpcp weighting function
HPCP uses a weighting function to determine the relative "strength of presence" of each note within a given Fourier Transform. At the current moment, it uses a curve of cos^2. This works relatively well for just about any instrument. However, since we are only focusing on piano for the moment, we can improve the curve to better match our needs. By looking at the Fourier transforms of many other piano notes, we should be able to detect a pattern amongst the distribution of frequencies generated by each note. By using the new curve generated by this data analysis, accuracy should be significantly improved.
General improvements
Generalizing to other instruments
Our implementation works only with Grand Piano at the moment. The change we would have to make in order to be able to work with more than one instruments is our approach in detecting note onsets. For instruments with clear note attacks, peak detection in the time domain makes perfect sense. However, for instruments such as flute, which might have a continuous transition between notes, we will have to tackle onset detection in the frequency domain using image analysis- take the spectrogram of the audio file and detect the times when power at frequencies change by a certain threshold.
We implemented this frequency domain analysis and got the same results as with time domain analysis for Grand Piano. You can find our MATLAB code for this frequency domain approach here:
Finding relationships between songs and variables
As it stands, our implementation uses many variables that we have used using evidence rather. It would be extremely helpful to the performance of the system if we could find exact relationships between the input signal and those variables. For example, our gain compression algorithm is non-dynamic in that we use a lambda value of 2; we know that each unique song performs better with a certain lambda. Another example is the beta value in the threshold for detection of the signal of interest being chord and/or note. This beta value was manually tweaked: low value if the song has higher likelihood of having chords and vice versa.