

| << Chapter < Page | Chapter >> Page > |
The normal distribution is the most important and widely used distribution in statistics. It is sometimes called the bell curve although the tonal qualities of such a bell would be less than pleasing. It is also called the Gaussian curve after the mathematician Karl-Friedrich Gauss.
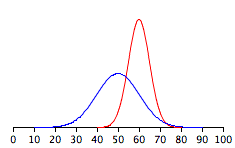
Strictly speaking, it is not correct to talk about the normal distribution since there are many normal distributions. Normal distributions candiffer in their means and in their standard deviations. [link] shows two normal distributions. The blue distribution has a mean of 50 and astandard deviation of 10; the distribution in red has a mean of 60 and a standard deviation of 5. Both distributions aresymmetric with relatively more values at the center of the distribution and relatively few in the tails.
The density of the normal distribution (the height for a given value on the x axis) of the normal distribution is shown below ( [link] ). The parameters and are the mean and standard deviation repectively and define the normal distribution. Thesymbol is the base of the natural logarithm and is the constant pi.
Since this is a non-mathematical treatment of statistics, do not worry if this expression confuses you. We will not be referring back to it in later sections.
Some features of normal distributions are listed below. These features are illustrated in more detail in the remainingsections of this chapter.
Notification Switch
Would you like to follow the 'Collaborative statistics (custom lecture version modified by t. short)' conversation and receive update notifications?

|
|

|
|

|
|

|
|

|
|
|
|
|

|
|

|
|

|
|

|