<< Chapter < Page Chapter >> Page >

Mathematics

Bonny and tommy at the sea

Educator section

Memorandum

It will probably only be learners in the first group who will progress as far as this module. Do not discourage learners who want to do this module. Even if they can only do a few of the activities they must be given the opportunity to do so. This must be handled carefully so that learners are not discouraged or feel inferior towards other learners. Neither must they develop negative attitudes towards Mathematics.

  • Number concept to 2 000
  • Operations: Consolidation and reinforcement of all the operations in previous modules.

A considerable amount of advanced and enrichment work is included and the educator must be familiar with each activity before the learners are expected to complete them.

In Module 8 number concept is extended to 2 000 . All operations are revised and consolidated. Several enrichment and challenging activities are included in this module and should only be given to learners who can manage them and who enjoy challenges. This selection process must be handled carefully and the other learners must not be discouraged or feel inferior towards other learners or the subject Mathematics.

A thorough discussion and explanation of the map on p. 3 as well as the table of distances on p. 4 should help learners complete these worksheets.

Number concept is extended to 2 000.

This is consolidation of the operations as in the previous modules. It offers an opportunity to identify problem areas.

These are to determine to what extent the learners’ logical thought processes have developed and to test and consolidate the basic work.

Telling the time on digital clocks/watches should only be done with learners who have mastered the telling of time on ordinary (analogue) clocks/watches. They need much practice in telling the time on ordinary clocks/watches and the corresponding time on digital clocks/watches before completing the worksheets.

Give the learners the opportunity to do these problems without help so that their progress can be determined.

Show examples and discuss ethnic patterns with the learners. Encourage them to bring examples to school and to share these with the class.

Use this for assessment purposes.

This is enrichment work and the educator should study this work first and then decide which of these worksheets should be used for which learners.

All learners who have progressed to Module 8 should be able to complete these worksheets with ease.

Do this activity practically in the classroom and let several learners explain what they see in front of them when walking behind someone. Let three learners stand next to one another and let the other learners stand in front of them. They must walk around the three standing in a line and observe them from behind so that they can discover that the order from left to right has changed.

Not much explanation is needed here as this activity is similar to the one where they used the table of distances.

Leaner section

Content

Activity: mass and height [lo 1.8, lo 1.9, lo 2.5]

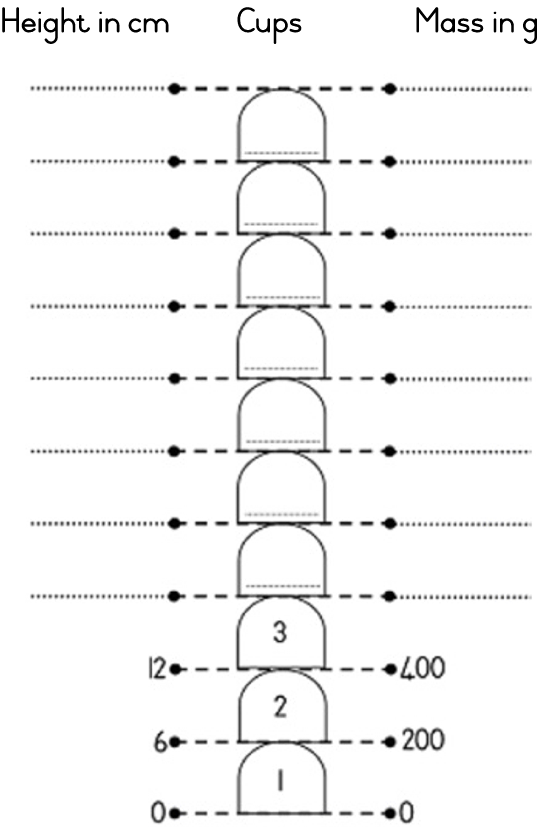
Here is Bonny and Tommy’s tower of sand. The mass of each cup of sand is 200 g and the height of each is 6 cm .

  • Complete:
  • How many cups of sand did they use to build the tower? _____________
  • What is the total mass of the tower? _________ g = ____________ kg
  • How many cups of sand were needed to build a tower with a mass of 3 kg?

_____________________________________________________________________

  • What is the total height of the tower? __________ cm = ____________ m
  • How many cups of sand were needed to build a tower with a height of 1,02 m?

_____________________________________________________________________

  • Which do you think has the greater mass, a cup of dry sand or a cup of wet sand? Give your reason.
  • Complete the starfish:

  • Draw at least two starfish and decorate them with ethnic patterns. Remember that all five arms of a starfish are identical.
  • Complete:
  • Bonny picked up 93 shells and wants to put the same amount into four buckets. How many will she put into each bucket and how many will be left over?

Assessment

Learning Outcome 1: The learner will be able to recognise, describe and represent numbers and their relationships, and to count, estimate, calculate and check with competence and confidence in solving problems.

Assessment Standard 1.8: We know this when the learner can perform calculations, using appropriate symbols, to solve problems;

Assessment Standard 1.9: We know this when the learner performs mental calculations;

Learning Outcome 2: The learner will be able to recognise, describe and represent patterns and relationships, as well as to solve problems using algebraic language and skills.

Assessment Standard 2.5: We know this when the learner identifies, describes and copies geometric patterns in natural and cultural artefacts of different cultures and times.

Questions & Answers

differentiate between demand and supply giving examples
Lambiv Reply
differentiated between demand and supply using examples
Lambiv
what is labour ?
Lambiv
how will I do?
Venny Reply
how is the graph works?I don't fully understand
Rezat Reply
information
Eliyee
devaluation
Eliyee
t
WARKISA
hi guys good evening to all
Lambiv
multiple choice question
Aster Reply
appreciation
Eliyee
explain perfect market
Lindiwe Reply
In economics, a perfect market refers to a theoretical construct where all participants have perfect information, goods are homogenous, there are no barriers to entry or exit, and prices are determined solely by supply and demand. It's an idealized model used for analysis,
Ezea
What is ceteris paribus?
Shukri Reply
other things being equal
AI-Robot
When MP₁ becomes negative, TP start to decline. Extuples Suppose that the short-run production function of certain cut-flower firm is given by: Q=4KL-0.6K2 - 0.112 • Where is quantity of cut flower produced, I is labour input and K is fixed capital input (K-5). Determine the average product of lab
Kelo
Extuples Suppose that the short-run production function of certain cut-flower firm is given by: Q=4KL-0.6K2 - 0.112 • Where is quantity of cut flower produced, I is labour input and K is fixed capital input (K-5). Determine the average product of labour (APL) and marginal product of labour (MPL)
Kelo
yes,thank you
Shukri
Can I ask you other question?
Shukri
what is monopoly mean?
Habtamu Reply
What is different between quantity demand and demand?
Shukri Reply
Quantity demanded refers to the specific amount of a good or service that consumers are willing and able to purchase at a give price and within a specific time period. Demand, on the other hand, is a broader concept that encompasses the entire relationship between price and quantity demanded
Ezea
ok
Shukri
how do you save a country economic situation when it's falling apart
Lilia Reply
what is the difference between economic growth and development
Fiker Reply
Economic growth as an increase in the production and consumption of goods and services within an economy.but Economic development as a broader concept that encompasses not only economic growth but also social & human well being.
Shukri
production function means
Jabir
What do you think is more important to focus on when considering inequality ?
Abdisa Reply
any question about economics?
Awais Reply
sir...I just want to ask one question... Define the term contract curve? if you are free please help me to find this answer 🙏
Asui
it is a curve that we get after connecting the pareto optimal combinations of two consumers after their mutually beneficial trade offs
Awais
thank you so much 👍 sir
Asui
In economics, the contract curve refers to the set of points in an Edgeworth box diagram where both parties involved in a trade cannot be made better off without making one of them worse off. It represents the Pareto efficient allocations of goods between two individuals or entities, where neither p
Cornelius
In economics, the contract curve refers to the set of points in an Edgeworth box diagram where both parties involved in a trade cannot be made better off without making one of them worse off. It represents the Pareto efficient allocations of goods between two individuals or entities,
Cornelius
Suppose a consumer consuming two commodities X and Y has The following utility function u=X0.4 Y0.6. If the price of the X and Y are 2 and 3 respectively and income Constraint is birr 50. A,Calculate quantities of x and y which maximize utility. B,Calculate value of Lagrange multiplier. C,Calculate quantities of X and Y consumed with a given price. D,alculate optimum level of output .
Feyisa Reply
Answer
Feyisa
c
Jabir
the market for lemon has 10 potential consumers, each having an individual demand curve p=101-10Qi, where p is price in dollar's per cup and Qi is the number of cups demanded per week by the i th consumer.Find the market demand curve using algebra. Draw an individual demand curve and the market dema
Gsbwnw Reply
suppose the production function is given by ( L, K)=L¼K¾.assuming capital is fixed find APL and MPL. consider the following short run production function:Q=6L²-0.4L³ a) find the value of L that maximizes output b)find the value of L that maximizes marginal product
Abdureman
types of unemployment
Yomi Reply
What is the difference between perfect competition and monopolistic competition?
Mohammed
Got questions? Join the online conversation and get instant answers!
Jobilize.com Reply

Get Jobilize Job Search Mobile App in your pocket Now!

Get it on Google Play Download on the App Store Now


Source:  OpenStax, Mathematics grade 3. OpenStax CNX. Oct 14, 2009 Download for free at http://cnx.org/content/col11128/1.1
Google Play and the Google Play logo are trademarks of Google Inc.

Notification Switch

Would you like to follow the 'Mathematics grade 3' conversation and receive update notifications?

Ask