

| << Chapter < Page | Chapter >> Page > |
A Venn diagram is a picture that represents the outcomes of an experiment. It generally consists of a box that represents the sample space S together with circles or ovals. The circles or ovals represent events.
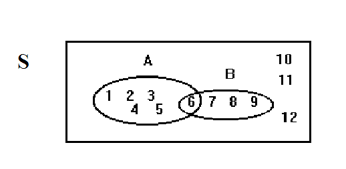
Suppose an experiment has the outcomes 1, 2, 3, ... , 12 where each outcome has an equal chance of occurring. Let event and event . Then and . The Venn diagram is as follows:
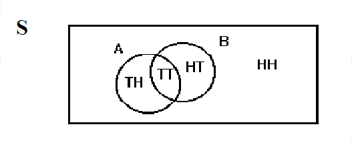
Flip 2 fair coins. Let = tails on the first coin. Let = tails on the second coin. Then and . Therefore, . .
The sample space when you flip two fair coins is . The outcome is in neither nor . The Venn diagram is as follows:
Forty percent of the students at a local college belong to a club and 50% work part time. Five percent of the students work part time and belong to a club. Draw a Venn diagram showing the relationships. Let = student belongs to a club and = student works part time.
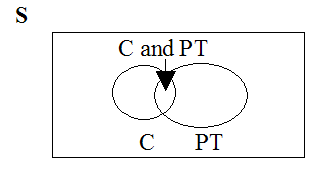
If a student is selected at random find
Notification Switch
Would you like to follow the 'Collaborative statistics using spreadsheets' conversation and receive update notifications?

|
|

|
|

|
|

|
|

|
|
|
|
|

|
|

|
|

|
|

|