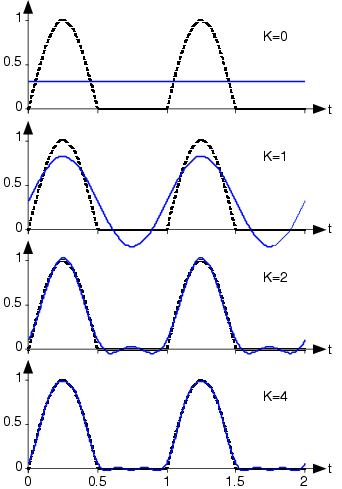
[link] shows how this
sequence of signals portrays the signal more accuratelyas more terms are added.
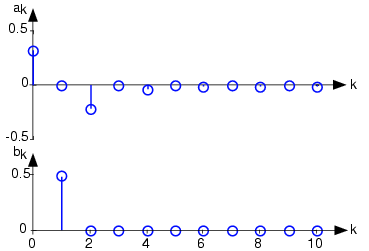
Fourier series spectrum of a half-wave rectified sine wave
The Fourier series spectrum of a half-wave rectified sinusoidis shown in the upper portion. The index indicates the
multiple of the fundamental frequency at which the signal hasenergy. The cumulative effect of adding terms to the Fourier
series for the half-wave rectified sine wave is shown in thebottom portion. The dashed line is the actual signal, with
the solid line showing the finite series approximation to theindicated number of terms,
.
We need to assess quantitatively the accuracy of theFourier series approximation so that we can judge how rapidly
the series approaches the signal. When we use a
-term series, the error—the difference between
the signal and the
-term series—corresponds to the unused terms from
the series.
To find the rms error, we must square this expression and
integrate it over a period. Again, the integral of mostcross-terms is zero, leaving
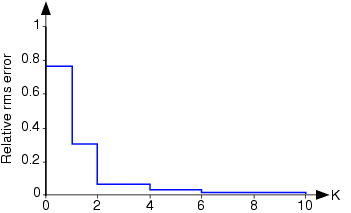
[link] shows how the error in the
Fourier series for the half-wave rectified sinusoid decreases asmore terms are incorporated. In particular, the use of four
terms, as shown in the bottom plot of
[link] , has a rms error (relative
to the rms value of the signal) of about 3%. The Fourier seriesin this case converges quickly to the signal.
Approximation error for a half-wave rectified sinusoid
The rms error calculated according to
[link] is shown as a function of the number of terms in theseries for the half-wave rectified sinusoid.
The error has been normalized by the rms value of thesignal.
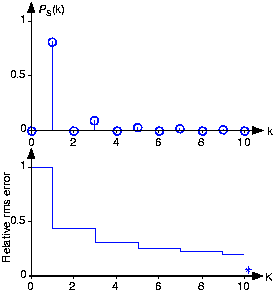
We can look at
[link] to
see the power spectrum and the rms approximation error for thesquare wave.
Power spectrum and approximation error for a square wave
The upper plot shows the power spectrum of the square wave,
and the lower plot the rms error of the finite-lengthFourier series approximation to the square wave. The
asterisk denotes the rms error when the number of terms
in the Fourier series equals 99. Because the Fourier coefficients decay more slowly here than for
the half-wave rectified sinusoid, the rms error is notdecreasing quickly. Said another way, the square-wave's
spectrum contains more power at higher frequencies than does thehalf-wave-rectified sinusoid. This difference between the two
Fourier series results because the half-wave rectifiedsinusoid's Fourier coefficients are proportional to
while those of the square wave are proportional to
. If fact, after 99 terms of the square wave's
approximation, the error is bigger than 10 terms of theapproximation for the half-wave rectified sinusoid.
Mathematicians have shown that no signal has an rmsapproximation error that decays more slowly than it does for the
square wave.
Step 1: Find the mean. To find the mean, add up all the scores, then divide them by the number of scores. ...
Step 2: Find each score's deviation from the mean. ...
Step 3: Square each deviation from the mean. ...
Step 4: Find the sum of squares. ...
Step 5: Divide the sum of squares by n – 1 or N.
The sample of 16 students is taken. The average age in the sample was 22 years with astandard deviation of 6 years. Construct a 95% confidence interval for the age of the population.
Bhartdarshan' is an internet-based travel agency wherein customer can see videos of the cities they plant to visit. The number of hits daily is a normally distributed random variable with a mean of 10,000 and a standard deviation of 2,400
a. what is the probability of getting more than 12,000 hits?
b. what is the probability of getting fewer than 9,000 hits?
Bhartdarshan'is an internet-based travel agency wherein customer can see videos of the cities they plan to visit. The number of hits daily is a normally distributed random variable with a mean of 10,000 and a standard deviation of 2,400.
a. What is the probability of getting more than 12,000 hits