

| << Chapter < Page | Chapter >> Page > |
Spectrogram and PSD
From the Neurosky Mindset we could gather data points in the time domain. Given this information though, we could not discern any differences between our experiments. Thus, we decided to analyze our data in the frequency domain using Matlab.
The Matlab function Spectrogram segments a time domain signal and for each segment calculates the fourier transform of each segment. The function produces a graphic much like the following:
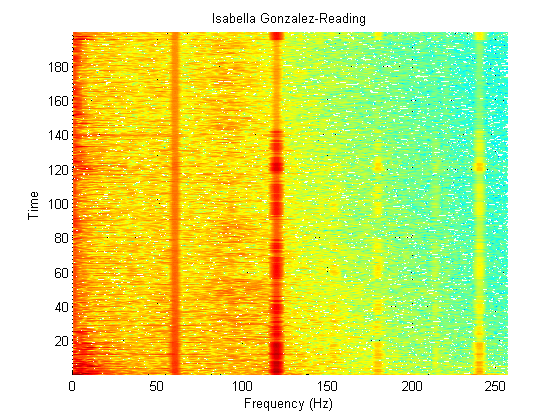
As one can see, at each time there is some frequency distribution, where red corresponds to a relatively large value and blue corresponds to a relatively small value.
The inputs to the function are the sampling frequency and the specific window. We set the sampling frequency to 512 since Neurosky samples at 512 HZ. We let the window be a hamming window because it seems to be the most widely used window for basic fourier analysis. We chose window size to be .4 seconds (200 samples) empirically based on how nice our figures looked.
The second function we used in Matlab was the Power spectral density (PSD) function. This function finds the average power at each frequency.
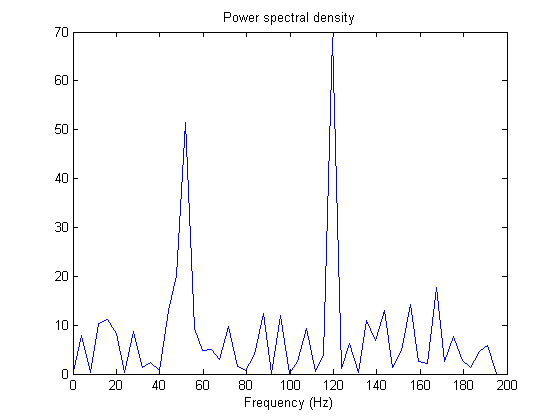
Both these methods gave us effective ways to find differences in our experimental data.
Notification Switch
Would you like to follow the 'Elec 301 projects fall 2011' conversation and receive update notifications?

|
|

|
|

|
|

|
|

|
|

|
|
|
|
|

|
|

|
|

|